Add breakpoints
To add breakpoints:
- Add a new breakpoint in one of the following ways:
- In the code editor, click the left margin or press F9 (F8 on macOS) on a particular line where you want the application to stop.
- In the Breakpoint Preset view or the Breakpoints view:
- Double-click the empty part of the view.
- Right-click the view, and select Add Breakpoint in the context menu.
- In Breakpoint type, select the location in the application code where you want the application to stop.
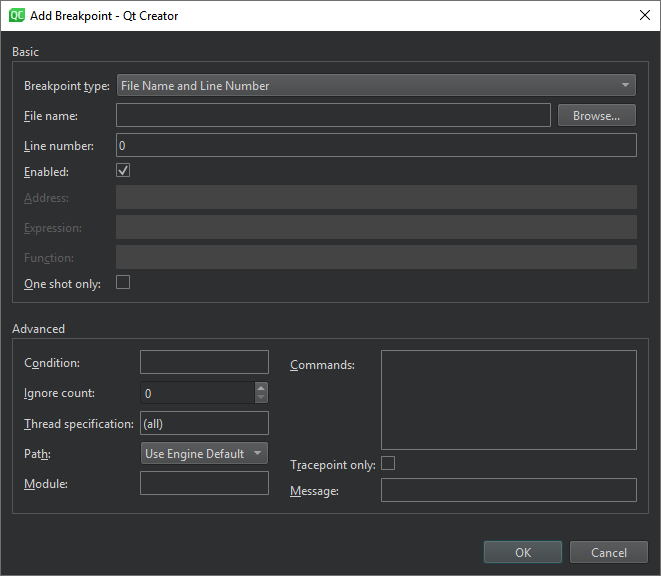
Clear Enabled to make the breakpoint temporarily inoperative as if you had deleted it, but keep the information about the breakpoint, so that you can enable it again later.
The other options to specify depend on the location you select, such as file name and line number, address, expression, or function name. The following table summarizes the advanced options.
| Option | Value |
|---|---|
| Condition | The condition to evaluate before stopping at the breakpoint if the condition evaluates as true. |
| Ignore count | The number of times to ignore the breakpoint before the application stops. |
| Thread specification | |
| Path | Determines how to specify the path when setting breakpoints:
|
| Module | Specify the module (base name of the library or executable) for function or file type breakpoints to speed up debugger startup (CDB, LLDB). |
| Commands | Commands to execute when the application stops. List one command per line. GDB executes the commands in the order in which you specify them. |
| Tracepoint only | A tracepoint lets you log information about the application without adding log statements or otherwise modifying your code. You can set conditions for the tracepoint. |
| Message | The tracepoint message to show in Application Output. |
See also How To: Debug, Debugging, Debuggers, and Debugger.
© 2024 The Qt Company Ltd. Documentation contributions included herein are the copyrights of their respective owners. The documentation provided herein is licensed under the terms of the GNU Free Documentation License version 1.3 as published by the Free Software Foundation. Qt and respective logos are trademarks of The Qt Company Ltd in Finland and/or other countries worldwide. All other trademarks are property of their respective owners.
