General
To set general preferences that are common to all debuggers, go to Preferences > Debugger > General.
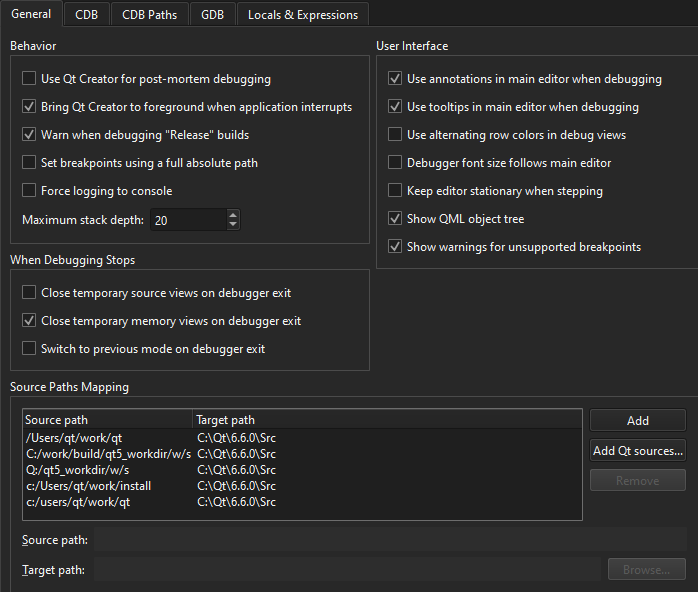
You can customize the appearance and behavior of the debug views and setting breakpoints, as well as map source paths to target paths.
You can view debug output in the Debugger Log view. However, in some Linux distributions, such as Arch Linux, debug output is sent to the system log. To override this behavior, select Force logging to console. This sets QT_LOGGING_TO_CONSOLE=1 in the environment of the debugged application, which effectively prevents storing debug output in system logs.
Breakpoints
To use a full absolute path in breakpoints, select Set breakpoints using a full absolute path.
GDB and CDB enable setting breakpoints on source lines for which no code was generated. In such situations, the breakpoint is shifted to the next source code line for which the code was actually generated. To reflect such temporary changes by moving the breakpoint markers in the source code editor, select GDB > Adjust breakpoint locations or CDB > Correct breakpoint location.
When using GDB as backend, you can extend the ordinary GDB breakpoint class by using Python. Select GDB > Use pseudo message tracepoints.
When using CDB as backend, you can specify that the debugger should break on specific events, such as C++ exceptions, thread creation or exit, loading or unloading application modules, or particular output by selecting preferences in CDB > Break on. To disable first-chance break on access violation exceptions, select Ignore first chance access violations. The second occurrence of an access violation will break into the debugger.
You can automatically add breakpoints on some functions to catch error and warning messages. For more information, see CDB and GDB.
For more information on breakpoints, see Breakpoints, Watchpoints, and Catchpoints in GDB documentation.
Source Paths Mapping
To enable the debugger to step into the code and display the source code when using a copy of the source tree at a location different from the one at which the libraries were built, you can map source paths to target paths.
To automatically map the source paths to a Qt version that has not been patched, select Add Qt Sources and browse to the location of the Qt source files.
To manually map the source paths to target paths:
- In Source Paths Mapping, select Add to add an entry to the path list.
- In Source path, specify the source path in the debug information of the executable as reported by the debugger.
- In Target path, specify the actual location of the source tree on the local machine.
See also How To: Debug, Debugging, Debuggers, and Debugger.
Copyright © The Qt Company Ltd. and other contributors. Documentation contributions included herein are the copyrights of their respective owners. The documentation provided herein is licensed under the terms of the GNU Free Documentation License version 1.3 as published by the Free Software Foundation. Qt and respective logos are trademarks of The Qt Company Ltd in Finland and/or other countries worldwide. All other trademarks are property of their respective owners.
