View code coverage reports from Coco
Note: Enable the Coco plugin to use it.
With Coco CoverageBrowser, you can analyze the test coverage by loading an instrumentation database (a .csmes file), which was generated by Coco CoverageScanner.
For more information about how to set up a project for code coverage in Qt Creator, see Set up code coverage from Coco.
To measure and check code coverage:
- Go to Analyze > Squish Coco.
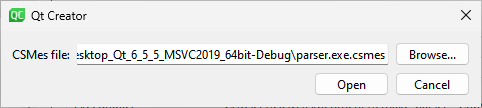
- In CSMes, select the instrumentation database to load.
- Select Open to start CoverageBrowser.
- In CoverageBrowser, go to File > Load Execution Report and select the
.csexefile for the coverage scan.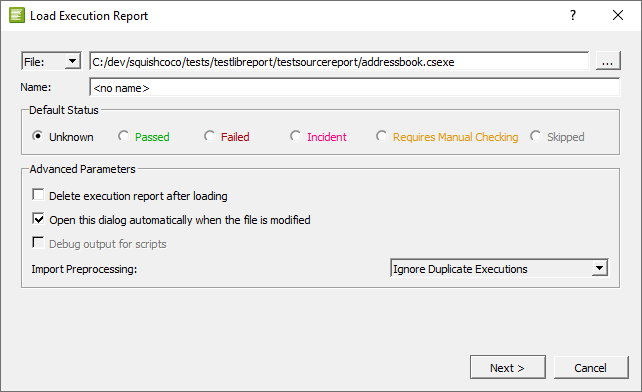
- To keep the execution report, clear Delete execution report after loading.
Open the analyzed files in Qt Creator. You can see the results of the analysis after the code in Edit mode. You can change the fonts and colors used for different types of results.
Change fonts and colors
To change the default fonts and colors, go to Preferences > Text Editor > Font & Colors. Create your own color scheme and select new fonts and colors for the following results:
- Code Coverage Added Code
- Partially Covered Code
- Uncovered Code
- Fully Covered Code
- Manually Validated Code
- Code Coverage Dead Code
- Code Coverage Execution Count too Low
- Implicitly Not Covered Code
- Implicitly Covered Code
- Implicit Manual Coverage Validation
See also Enable and disable plugins, Set up code coverage from Coco, Font & Colors, and Analyzing Code.
Copyright © The Qt Company Ltd. and other contributors. Documentation contributions included herein are the copyrights of their respective owners. The documentation provided herein is licensed under the terms of the GNU Free Documentation License version 1.3 as published by the Free Software Foundation. Qt and respective logos are trademarks of The Qt Company Ltd in Finland and/or other countries worldwide. All other trademarks are property of their respective owners.
