
AreaChart Example
The example shows how to create a simple area chart.
Running the Example
To run the example from Qt Creator , open the Welcome mode and select the example from Examples. For more information, visit Building and Running an Example.
Creating Area Charts
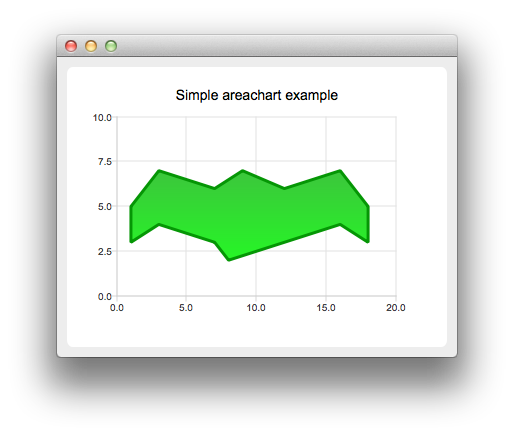
To create area charts, we need two QLineSeries instances. They are going to define the upper and lower boundary of the area.
series0 = QLineSeries()
series1 = QLineSeries()
We add data to both series and use the stream operator.
series0 << QPointF(1, 5) << QPointF(3, 7) << QPointF(7, 6) << QPointF(9, 7) << QPointF(12, 6)
         << QPointF(16, 7) << QPointF(18, 5)
series1 << QPointF(1, 3) << QPointF(3, 4) << QPointF(7, 3) << QPointF(8, 2) << QPointF(12, 3)
         << QPointF(16, 4) << QPointF(18, 3)
Now we create a QAreaSeries instance using two line series objects. We set the custom gradient fill and width of the outline.
series = QAreaSeries(series0, series1)
series.setName("Batman")
pen = QPen(0x059605)
pen.setWidth(3)
series.setPen(pen)
gradient = QLinearGradient(QPointF(0, 0), QPointF(0, 1))
gradient.setColorAt(0.0, 0x3cc63c)
gradient.setColorAt(1.0, 0x26f626)
gradient.setCoordinateMode(QGradient.ObjectBoundingMode)
series.setBrush(gradient)
Last we create the QChartView instance, set the title, set anti-aliasing, and add the area series. We also create the default axes and specify the ranges on them.
chart = QChart()
chart.addSeries(series)
chart.setTitle("Simple areachart example")
chart.createDefaultAxes()
chart.axes(Qt.Horizontal).first().setRange(0, 20)
chart.axes(Qt.Vertical).first().setRange(0, 10)
The chart is ready to be shown.
chartView = QChartView(chart)
chartView.setRenderHint(QPainter.Antialiasing)