Viewing disassembled code
A disassembler translates machine language into assembly language for human-readability.
The Disassembler view displays disassembled code for the current function. It is useful for low-level commands for checking single instructions, such as Step Into and Step Over.
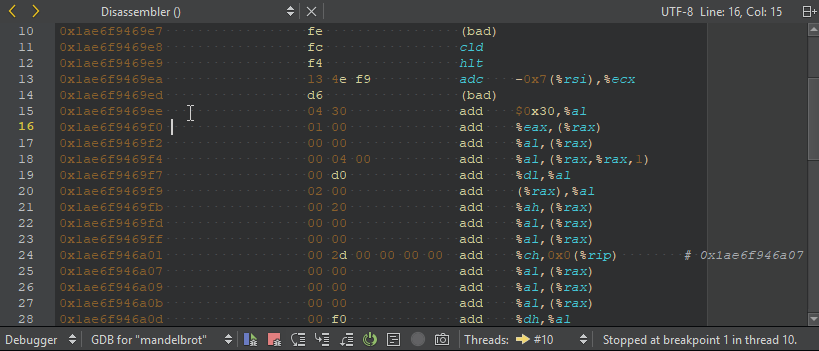
By default, GDB shows AT&T style disassembly. To switch to the Intel style, go to Preferences > Debugger > GDB > Use Intel style disassembly.
To open the Disassembler view:
- Go to Debug > Operate by Instruction while the debugger is running.
- Select
 (Operate by Instruction) on the debugger toolbar.
 - In the Registers view, select a value, and then select Open Disassembler at <value> in the context menu.
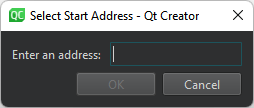
Starting disassembler
To start a disassembler from the Registers view, select Open Disassembler and set the disassembler address:
See also How to: Debug, Debugging, and Debuggers.
Copyright © The Qt Company Ltd. and other contributors. Documentation contributions included herein are the copyrights of their respective owners. The documentation provided herein is licensed under the terms of the GNU Free Documentation License version 1.3 as published by the Free Software Foundation. Qt and respective logos are trademarks of The Qt Company Ltd in Finland and/or other countries worldwide. All other trademarks are property of their respective owners.
