PySide6.QtGraphsWidgets.Q3DScatterWidgetItem
- class Q3DScatterWidgetItem
The
Q3DScatterWidgetItemclass provides methods for rendering 3D scatter graphs. More…Synopsis
Properties
axisXᅟ- Active x-axisaxisYᅟ- Active y-axisaxisZᅟ- Active z-axisselectedSeriesᅟ- Selected series or null
Methods
def
__init__()def
addAxis()def
addSeries()def
axes()def
axisX()def
axisY()def
axisZ()def
releaseAxis()def
removeSeries()def
selectedSeries()def
seriesList()def
setAxisX()def
setAxisY()def
setAxisZ()
Signals
def
axisXChanged()def
axisYChanged()def
axisZChanged()
Note
This documentation may contain snippets that were automatically translated from C++ to Python. We always welcome contributions to the snippet translation. If you see an issue with the translation, you can also let us know by creating a ticket on https:/bugreports.qt.io/projects/PYSIDE
Detailed Description
Warning
This section contains snippets that were automatically translated from C++ to Python and may contain errors.
This class enables developers to render 3D scatter graphs and view them by freely rotating the scene. Rotation is achieved by holding down the right mouse button and moving the mouse, while zooming is accomplished using the mouse wheel. If enabled, selection is performed with the left mouse button. The scene can be reset to the default camera view by clicking the mouse wheel. On touch devices, rotation is achieved by tap-and-move, selection by tap-and-hold, and zooming by pinch.
If no axes are set explicitly to
Q3DScatterWidgetItem, temporary default axes with no labels are created. These default axes can be modified via axis accessors, but as soon any axis is set explicitly for the orientation, the default axis for that orientation is destroyed.Q3DScatterWidgetItemsupports more than one series visible at the same time.Q3DScatterWidgetItemhas transparency support. This feature allows you to adjust the opacity of the scatter points, making them partially see-through, fully transparent, or opaque.How to construct a minimal Q3DScatterWidgetItem graph
First, construct
Q3DScatterWidgetItem. Since we are running the graph as the top-level window in this example, we need to clear theQt::FramelessWindowHintflag, which is set by default:quickWidget = QQuickWidget() scatter = Q3DScatterWidgetItem() scatter.setWidget(quickWidget) scatter.widget().setMinimumSize(QSize(256, 256))
Now
Q3DScatterWidgetItemis ready to receive data to be rendered. Add one series of 3 QVector3D items:Note
In the new proxy-series relationship, data is held in series. Therefore, for the proxy to be able to add, delete, or edit the data, it is a prerequisite to create a series first.
series = QScatter3DSeries()
data = QScatterDataArray()
data << QScatterDataItem(0.5f, 0.5f, 0.5f) << QScatterDataItem(-0.3f, -0.5f, -0.4f)
     << QScatterDataItem(0.0f, -0.3f, 0.2f)
series.dataProxy().addItems(data)
scatter.addSeries(series)
Finally you will need to set it visible:
scatter.widget().show()
The complete code needed to create and display this graph is:
if __name__ == "__main__":

    app = QApplication([])
    //! [0]
    quickWidget = QQuickWidget()
    scatter = Q3DScatterWidgetItem()
    scatter.setWidget(quickWidget)
    scatter.widget().setMinimumSize(QSize(256, 256))
    //! [0]
    //! [1]
    series = QScatter3DSeries()
    data = QScatterDataArray()
    data << QScatterDataItem(0.5f, 0.5f, 0.5f) << QScatterDataItem(-0.3f, -0.5f, -0.4f)
         << QScatterDataItem(0.0f, -0.3f, 0.2f)
    series.dataProxy().addItems(data)
    scatter.addSeries(series)
    //! [1]
    //! [2]
    scatter.widget().show()
    //! [2]
    sys.exit(app.exec())
And this is what those few lines of code produce:
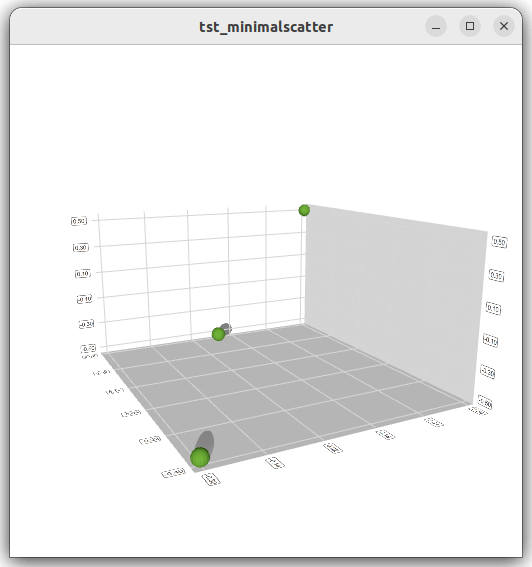
The scene can be rotated, zoomed into, and an item can be selected to view its position, but no other interactions are included in this minimal code example. You can learn more by familiarizing yourself with the examples provided, like the Simple Scatter Graph .
Note
Properties can be used directly when
from __feature__ import true_propertyis used or via accessor functions otherwise.- property axisXᅟ: QValue3DAxis
This property holds The active x-axis..
Sets
axisas the active x-axis. Implicitly callsaddAxis()to transfer the ownership of the axis to this graph.If
axisis null, a temporary default axis with no labels and an automatically adjusting range is created. This temporary axis is destroyed if another axis is set explicitly to the same orientation.See also
- Access functions:
Signal
axisXChanged()
- property axisYᅟ: QValue3DAxis
This property holds The active y-axis..
Sets
axisas the active y-axis. Implicitly callsaddAxis()to transfer the ownership of the axis to this graph.If
axisis null, a temporary default axis with no labels and an automatically adjusting range is created. This temporary axis is destroyed if another axis is set explicitly to the same orientation.See also
- Access functions:
Signal
axisYChanged()
- property axisZᅟ: QValue3DAxis
This property holds The active z-axis..
Sets
axisas the active z-axis. Implicitly callsaddAxis()to transfer the ownership of the axis to this graph.If
axisis null, a temporary default axis with no labels and an automatically adjusting range is created. This temporary axis is destroyed if another axis is set explicitly to the same orientation.See also
- Access functions:
Signal
axisZChanged()
- property selectedSeriesᅟ: QScatter3DSeries
This property holds The selected series or null..
- Access functions:
Constructs a new 3D scatter graph with the optional
parent.- addAxis(axis)
- Parameters:
axis –
QValue3DAxis
Adds
axisto the graph. The axes added via addAxis are not yet taken to use, addAxis is simply used to give the ownership of theaxisto the graph. Theaxismust not be null or added to another graph.See also
- addSeries(series)
- Parameters:
series –
QScatter3DSeries
Adds the
seriesto the graph. A graph can contain multiple series, but has only one set of axes. If the newly added series has specified a selected item, it will be highlighted and any existing selection will be cleared. Only one added series can have an active selection.See also
- axes()
- Return type:
.list of QValue3DAxis
Returns the list of all added axes.
See also
- axisX()
- Return type:
See also
Getter of property
axisXᅟ.- axisXChanged(axis)
- Parameters:
axis –
QValue3DAxis
Notification signal of property
axisXᅟ.- axisY()
- Return type:
See also
Getter of property
axisYᅟ.- axisYChanged(axis)
- Parameters:
axis –
QValue3DAxis
Notification signal of property
axisYᅟ.- axisZ()
- Return type:
See also
Getter of property
axisZᅟ.- axisZChanged(axis)
- Parameters:
axis –
QValue3DAxis
Notification signal of property
axisZᅟ.- releaseAxis(axis)
- Parameters:
axis –
QValue3DAxis
Releases the ownership of the
axisback to the caller, if it is added to this graph. If the releasedaxisis in use, a new default axis will be created and set active.If the default axis is released and added back later, it behaves as any other axis would.
See also
- removeSeries(series)
- Parameters:
series –
QScatter3DSeries
Removes the
seriesfrom the graph.See also
- selectedSeries()
- Return type:
Getter of property
selectedSeriesᅟ.- selectedSeriesChanged(series)
- Parameters:
series –
QScatter3DSeries
Notification signal of property
selectedSeriesᅟ.- seriesList()
- Return type:
.list of QScatter3DSeries
Returns the list of series added to this graph.
See also
- setAxisX(axis)
- Parameters:
axis –
QValue3DAxis
See also
Setter of property
axisXᅟ.- setAxisY(axis)
- Parameters:
axis –
QValue3DAxis
See also
Setter of property
axisYᅟ.- setAxisZ(axis)
- Parameters:
axis –
QValue3DAxis
See also
Setter of property
axisZᅟ.