PercentBarSeries QML Type
Presents a series of categorized data as a percentage of each category. More...
| Import Statement: | import QtCharts 2.5 |
| Instantiates: | QPercentBarSeries |
| Inherits: |
Detailed Description
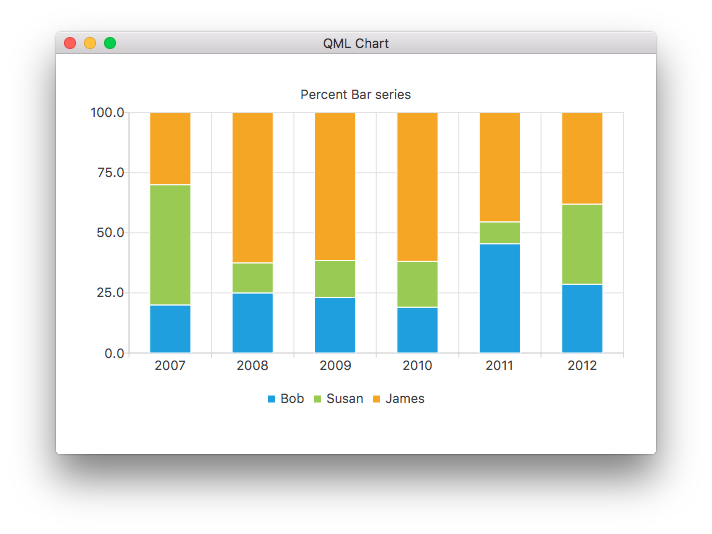
The data is drawn as a series of uniformly sized vertically stacked bars, with one bar per category. Each bar set added to the series contributes a single segment to each stacked bar. The segment size corresponds to the percentage of the segment value compared with the total value of all segments in the stack. Bars with zero value are not drawn.
The following QML code snippet shows how to create a simple percent bar chart:
ChartView {
    title: "Percent Bar Chart"
    anchors.fill: parent
    legend.alignment: Qt.AlignBottom
    antialiasing: true

    PercentBarSeries {
        axisX: BarCategoryAxis { categories: ["2007", "2008", "2009", "2010", "2011", "2012" ] }
        BarSet { label: "Bob"; values: [2, 2, 3, 4, 5, 6] }
        BarSet { label: "Susan"; values: [5, 1, 2, 4, 1, 7] }
        BarSet { label: "James"; values: [3, 5, 8, 13, 5, 8] }
    }
}
© 2026 The Qt Company Ltd. Documentation contributions included herein are the copyrights of their respective owners. The documentation provided herein is licensed under the terms of the GNU Free Documentation License version 1.3 as published by the Free Software Foundation. Qt and respective logos are trademarks of The Qt Company Ltd. in Finland and/or other countries worldwide. All other trademarks are property of their respective owners.
