SplineSeries QML Type
Presents data as spline charts. More...
| Import Statement: | import QtCharts 2.13 |
| In C++: | QSplineSeries |
| Inherits: | |
| Status: | Deprecated |
This type is deprecated. We strongly advise against using it in new code.
Properties
Detailed Description
A spline series stores the data points and the segment control points needed by QPainterPath to draw a spline. The control points are automatically calculated when the data changes. The algorithm computes the points so that the normal spline can be drawn.
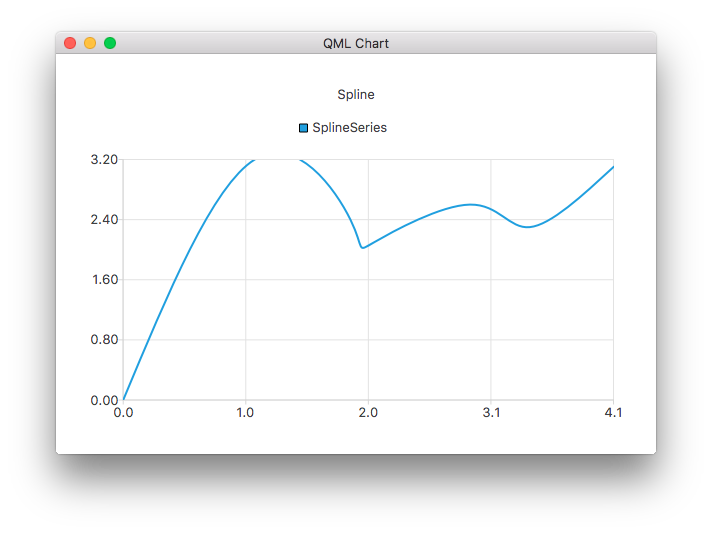
The following QML code shows how to create a simple spline chart:
ChartView {
    title: "Spline Chart"
    anchors.fill: parent
    antialiasing: true

    SplineSeries {
        name: "Spline"
        XYPoint { x: 0; y: 0.0 }
        XYPoint { x: 1.1; y: 3.2 }
        XYPoint { x: 1.9; y: 2.4 }
        XYPoint { x: 2.1; y: 2.1 }
        XYPoint { x: 2.9; y: 2.6 }
        XYPoint { x: 3.4; y: 2.3 }
        XYPoint { x: 4.1; y: 3.1 }
    }
}
Property Documentation
capStyle : Qt::PenCapStyle
Controls the cap style of the line. Set to one of Qt.FlatCap, Qt.SquareCap or Qt.RoundCap. By default, the cap style is Qt.SquareCap.
See also Qt::PenCapStyle.
count : int
The number of data points in the series.
style : Qt::PenStyle
Controls the style of the line. Set to one of Qt.NoPen, Qt.SolidLine, Qt.DashLine, Qt.DotLine, Qt.DashDotLine, or Qt.DashDotDotLine. Using Qt.CustomDashLine is not supported in the QML API. By default, the style is Qt.SolidLine.
See also Qt::PenStyle.
width : real
The width of the line. By default, the width is 2.0.
© 2026 The Qt Company Ltd. Documentation contributions included herein are the copyrights of their respective owners. The documentation provided herein is licensed under the terms of the GNU Free Documentation License version 1.3 as published by the Free Software Foundation. Qt and respective logos are trademarks of The Qt Company Ltd. in Finland and/or other countries worldwide. All other trademarks are property of their respective owners.
