AreaSeries QML Type
Presents data in area graphs. More...
| Import Statement: | import QtGraphs |
| In C++: | QAreaSeries |
| Inherits: |
- List of all members, including inherited members
- AreaSeries is part of Qt Graphs QML Types for 2D.
Properties
- borderColor : color
- borderWidth : real
- color : color
- gradient : ShapeGradient
(since 6.11) - lowerSeries : XYSeries
- selected : bool
- selectedBorderColor : color
- selectedColor : color
- selectedGradient : ShapeGradient
(since 6.11) - upperSeries : XYSeries
Signals
- borderColorChanged(color newBorderColor)
- borderWidthChanged()
- clicked(point point)
- colorChanged(color newColor)
- doubleClicked(point point)
- gradientChanged()
(since 6.11) - lowerSeriesChanged()
- pressed(point point)
- released(point point)
- selectedBorderColorChanged(color newSelectedBorderColor)
- selectedChanged()
- selectedColorChanged(color newSelectedColor)
- selectedGradientChanged()
(since 6.11) - upperSeriesChanged()
Detailed Description
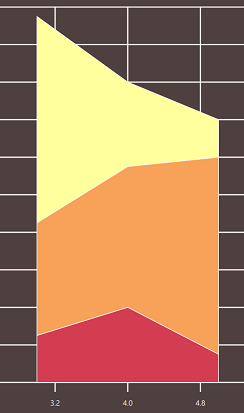
An area graph is used to draw an area composed by points. The points are defined by two series: upperSeries and lowerSeries. The area between the series is drawn as a graph. If only the upperSeries is defined, the area is then between the bottom of the graph and the upper series.
Property Documentation
borderColor : color
The border color of the area. The default value is transparent, meaning the border color is defined by the theme.
borderWidth : real
The width of the line that encloses the area. The default value is -1, meaning the border width is defined by the theme.
color : color
The fill color of the area. The default value is transparent, meaning the color is defined by the theme.
Note: If gradient is set to something other than null, these will take precedence over color. The color will be ignored in this case.
gradient : ShapeGradient [since 6.11]
This property defines the fill gradient. By default no gradient is enabled and the value is null. In this case the fill will be based on the color property.
Note: The Gradient type cannot be used here. Rather, prefer using one of the advanced subtypes, like LinearGradient.
Note: If set to something other than null, the gradient will take precedence over color.
This property was introduced in Qt 6.11.
lowerSeries : XYSeries
Sets the lower boundary of the area. If this is null, the graph bottom is considered the lower bound.
selected : bool
Sets this area as selected. The default value is false.
selectedBorderColor : color
The border color of the area when selected. The default value is transparent, meaning the selected border color is defined by the theme.
selectedColor : color
The fill color of the area when selected. The default value is transparent, meaning the selected color is defined by the theme.
Note: If selectedGradient is set to something other than null, these will take precedence over selectedColor. The selectedColor will be ignored in this case.
selectedGradient : ShapeGradient [since 6.11]
This property defines the fill gradient of the area when selected. By default no gradient is enabled and the value is null. In this case the fill will be based on the selectedColor property.
Note: The Gradient type cannot be used here. Rather, prefer using one of the advanced subtypes, like LinearGradient.
Note: If set to something other than null, the selectedGradient will take precedence over selectedColor.
This property was introduced in Qt 6.11.
upperSeries : XYSeries
Sets the upper boundary of the area. No area is drawn if this is null.
Signal Documentation
borderColorChanged(color newBorderColor)
This signal is emitted when the area border color changes to newBorderColor.
Note: The corresponding handler is onBorderColorChanged.
borderWidthChanged()
This signal is emitted when the width of the area border width changes.
Note: The corresponding handler is onBorderWidthChanged.
clicked(point point)
This signal is emitted when the user clicks or taps an area graph. The point specifies the event triggered position.
Note: The corresponding handler is onClicked.
colorChanged(color newColor)
This signal is emitted when the area color changes to newColor.
Note: The corresponding handler is onColorChanged.
doubleClicked(point point)
This signal is emitted when the user double-clicks or double-taps an area graph. The point specifies the event triggered position. This signal always occurs after clicked.
Note: The corresponding handler is onDoubleClicked.
[since 6.11] gradientChanged()
This signal is emitted when the gradient changes.
Note: The corresponding handler is onGradientChanged.
This signal was introduced in Qt 6.11.
lowerSeriesChanged()
This signal is emitted when the lower series changes.
Note: The corresponding handler is onLowerSeriesChanged.
pressed(point point)
This signal is emitted when the user clicks or taps the area graph and holds down the mouse button or gesture. The point specifies the event triggered position.
Note: The corresponding handler is onPressed.
released(point point)
This signal is emitted when the user releases a pressed click or tap. The point specifies the event triggered position.
Note: The corresponding handler is onReleased.
selectedBorderColorChanged(color newSelectedBorderColor)
This signal is emitted when the border color of a selected area changes to newSelectedBorderColor.
Note: The corresponding handler is onSelectedBorderColorChanged.
selectedChanged()
This signal is emitted when the current area is selected.
Note: The corresponding handler is onSelectedChanged.
selectedColorChanged(color newSelectedColor)
This signal is emitted when the color of a selected area changes to newSelectedColor.
Note: The corresponding handler is onSelectedColorChanged.
[since 6.11] selectedGradientChanged()
This signal is emitted when the gradient of a selected area changes.
Note: The corresponding handler is onSelectedGradientChanged.
This signal was introduced in Qt 6.11.
upperSeriesChanged()
This signal is emitted when the upper series changes.
Note: The corresponding handler is onUpperSeriesChanged.
© 2026 The Qt Company Ltd. Documentation contributions included herein are the copyrights of their respective owners. The documentation provided herein is licensed under the terms of the GNU Free Documentation License version 1.3 as published by the Free Software Foundation. Qt and respective logos are trademarks of The Qt Company Ltd. in Finland and/or other countries worldwide. All other trademarks are property of their respective owners.
