CustomSeries QML Type
The CustomSeries type allows presenting customized graph types. More...
| Import Statement: | import QtGraphs |
| Since: | Qt 6.11 |
| In C++: | QCustomSeries |
Properties
- delegate : Component
Methods
- void append()
- void append(var data)
- void clear()
- void insert(int index)
- void insert(int index, var data)
- real mapX(real x)
- real mapY(real y)
- void remove(int index)
Detailed Description
Use CustomSeries to create customized graphs. Think of it as a scatter graph that lets you access custom data for each element.
CustomSeries defines a delegate that is used to render every item added to the graph. Each item includes user-defined data stored in a QVariantMap. Index of the item in the graph is also automatically added to the data map. In the QML context the variant map is defined by a JavaScript object. The series passes this map to each element created based on the delegate. The delegate determines how to use the data.
To map data to the render coordinates defined by the GraphsView axes, use the mapX and mapY functions.
Note: Currently, individual elements in a custom series do not share information with one another. For this reason, you can't implement a custom line series.
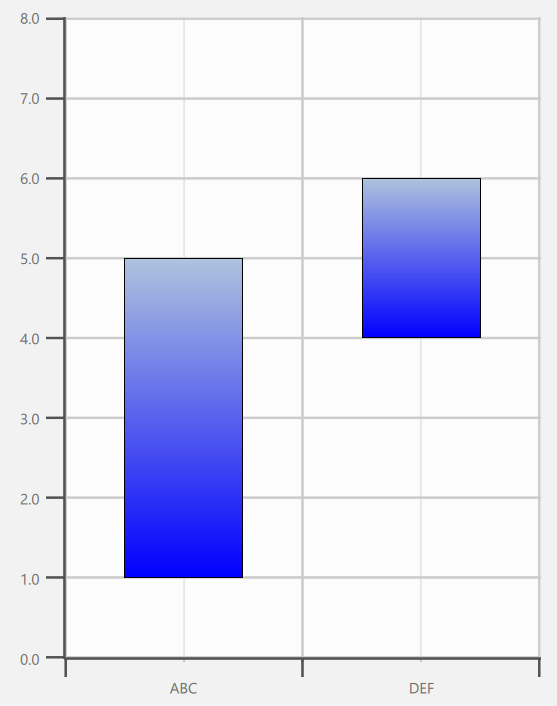
The following code implements the depicted custom graph. In this case the custom data contains two values: upper and lower. Those are then defined in the delegate to affect the height and the y coordinate of the element.
import QtQuick
import QtGraphs

Window {
    width: 640
    height: 480
    visible: true

    GraphsView {
        anchors.fill: parent

        axisX: BarCategoryAxis {
            categories: ["ABC", "DEF"]
        }

        axisY: ValueAxis {
            max: 8
            tickInterval: 1
        }

        CustomSeries {
            id: custom

            delegate: Rectangle {
                property var data
                gradient: Gradient {
                    GradientStop { position: 0.0; color: "lightsteelblue" }
                    GradientStop { position: 1.0; color: "blue" }
                }
                border.width: 1
                x: custom.mapX(data.index + 0.5) - width * 0.5
                y: custom.mapY((data.upper + data.lower) * 0.5) - height * 0.5
                width: Math.abs(custom.mapX(1) - custom.mapX(0)) * 0.5
                height: Math.abs(custom.mapY(data.upper) - custom.mapY(data.lower))
            }

            CustomSeriesData {
                data: ({
                    upper: 5,
                    lower: 1
                })
            }

            CustomSeriesData {
                data: ({
                    upper: 6,
                    lower: 4
                })
            }
        }
    }
}
Property Documentation
delegate : Component
The delegate is used to insert elements to QML corresponding to provided custom data. Data is defined in the the CustomSeries itself and given to the delegated elements through the "data" property.
delegate: Rectangle {
        property var data
        Rectangle {
            color: "tan"
            border.color: "black"
            border.width: 4
            y: series.mapY(data.index + 1) - height / 2 + 1
            x: series.mapX(data.median) - width / 2
            height: 32
            width: Math.abs(series.mapX(data.upperQuartile) - series.mapX(data.lowerQuartile))
        }
    }
}
Method Documentation
void append()
Appends an empty data item to the series.
void append(var data)
Appends a data item defined by data to the series.
void clear()
Clear all data items.
void insert(int index)
Appends an empty data item to the series at position index.
void insert(int index, var data)
Appends a data item defined by data to the series at position index.
real mapX(real x)
Returns x axis-space coordinate converted into render-space.
real mapY(real y)
Returns y axis-space coordinate converted into render-space.
void remove(int index)
Remove a data item at position index.
© 2026 The Qt Company Ltd. Documentation contributions included herein are the copyrights of their respective owners. The documentation provided herein is licensed under the terms of the GNU Free Documentation License version 1.3 as published by the Free Software Foundation. Qt and respective logos are trademarks of The Qt Company Ltd. in Finland and/or other countries worldwide. All other trademarks are property of their respective owners.
