Run Valgrind tools on external applications
With Valgrind's Tool Suite, you can detect memory leaks and profile function execution.
To run the Valgrind tools to analyze external applications for which you do not have a Qt Creator project:
- Go to Analyze > Valgrind Memory Analyzer (External Application) or Valgrind Function Profiler (External Application).
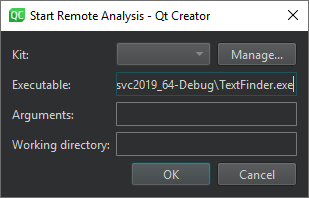
- Select the application to run and analyze, as well as the kit to use.
See also Detect memory leaks with Memcheck, Profile function execution, Managing kits, Specify Valgrind settings for a project, Valgrind Callgrind, and Valgrind Memcheck.
Copyright © The Qt Company Ltd. and other contributors. Documentation contributions included herein are the copyrights of their respective owners. The documentation provided herein is licensed under the terms of the GNU Free Documentation License version 1.3 as published by the Free Software Foundation. Qt and respective logos are trademarks of The Qt Company Ltd in Finland and/or other countries worldwide. All other trademarks are property of their respective owners.
