C
Qt Quick Ultralite Performance Logging
This topic focuses on how to obtain performance metrics and memory footprint information for your Qt Quick Ultralite application.
Qt Quick Ultralite performance logs
Qt Quick Ultralite can collect important performance metrics such as
- CPU idle time,
- stack and heap usage,
- frame rate,
- cache usage,
- useful information about time spent on rendering,
- and text layout.
These logs are output through the board's serial port, which can be observed using a serial terminal on the host machine. To enable and view the performance logs:
- To collect performance metrics, the Qt Quick Ultralite Core library has to be built with
QUL_ENABLE_PERFORMANCE_LOGGINGCMake option enabled. Since Qt for MCUs 2.6 this is the default for shipped libraries. - To also enable performance logging output over the serial console, enable the
QUL_ENABLE_PERFORMANCE_CONSOLE_OUTPUTCMake option, and rebuild the Qt Quick Ultralite Core library. - To see the CPU usage on platforms that support it, the Qt Quick Ultralite Platform library has to be built with
QUL_ENABLE_HARDWARE_PERFORMANCE_LOGGINGCMake option enabled. Since Qt for MCUs 2.6 this is the default for shipped libraries. For more information, see CPU usage. - Performance logs are sent to the host computer over serial connection.
- Use the serial terminal of your choice to view the performance logging output.
Note: Since Qt for MCUs 2.6, Qt Quick Ultralite Core and Platform libraries are shipped with QUL_ENABLE_PERFORMANCE_LOGGING and QUL_ENABLE_HARDWARE_PERFORMANCE_LOGGING enabled by default. While useful to profile your application, performance metrics collection adds an unwanted overhead for production ready applications. To remove it, rebuild the Qt Quick Ultralite libraries with QUL_ENABLE_PERFORMANCE_LOGGING and QUL_ENABLE_HARDWARE_PERFORMANCE_LOGGING disabled.
These steps are explained in detail below.
Enabling performance logs
To enable the Qt Quick Ultralite performance logging feature, rebuild the Qt Quick Ultralite Core library with the -DQUL_ENABLE_PERFORMANCE_LOGGING=on CMake option (already enabled by default with Qt for MCUs 2.6). You can direct the logging output over the serial console by using the -DQUL_ENABLE_PERFORMANCE_CONSOLE_OUTPUT=on CMake option together with the earlier option.
If the performance logging is enabled, you can display the metrics directly in the UI using the QulPerf QML type.
Note: It's not sufficient to specify these options when building your application. The Qt Quick Ultralite libraries have to be built from sources as described in the Building Qt Quick Ultralite from sources page.
Viewing the performance logs
Use a serial terminal such as minicom, gtkterm, PuTTY, or hyperterm to connect to the device that's running an application built with performance logging enabled.
Assuming that the device offers a serial port using a virtual COM port when connected via USB to the host device, here's how to view the performance logs.
Note: Performance logs are available only when the screen contents are changing. If there are no active animations, you should interact with the application for a while to see the performance logs.
Linux
On Linux, note which /dev/ttyACM* or /dev/ttyUSB* port shows up when the target device is connected to the host machine. If you are using minicom, connect to the device using the following command:
minicom -D /dev/ttyACM2
It might be necessary to explicitly add carriage returns to the log output on some boards such as Infineon TRAVEO™ T2G. On a minicom terminal, you can add carriage return to the incoming text by pressing Ctrl+'a', followed by the 'u' key.
Windows
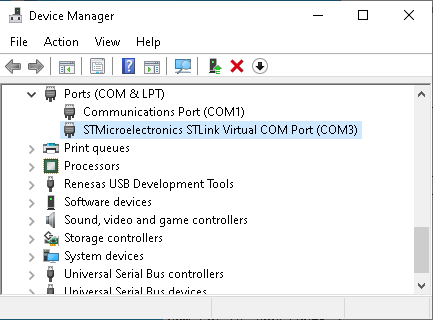
Here's how to use the PuTTY terminal to view the performance logs on Windows. First check in the Device Manager to see which device appears when the target device is connected:
Configure PuTTY accordingly with:
- a serial connection type,
- serial line as identified by the device manager,
- and speed of 115200.
You could also find the appropriate baud rate for the target device and adjust the speed accordingly.

The console logging and performance logging output from the QML application should now be visible.
Note: The serial terminal approach does not work with the RH850 D1M1A reference board. Instead, flash the application .elf file using the "Debug Other Executable" option from the Debug menu in the MULTI Project Manager. The console and performance logs should then be visible in the debugger view. The logging is very slow on the RH850, so you should consider enabling the feature temporarily in order to gather the performance metrics.
Sample log
Here's some sample output from the performance logging feature, with QUL_ENABLE_PERFORMANCE_CONSOLE_OUTPUT enabled:
Memory usage:
Heap: 61596/67820 (in-use/total)
Stack: 13132 (peak)
Resource cache for allocation type 1: 3 texture(s), 1620 KB used / 2160 KB total
Text cache: 31481 bytes used out of 32768 bytes max
Monotype spark cache: 35056 bytes used out of 200000 bytes max
refresh intervals: 1: 7, 2: 18, 3: 6,
10 fps (last 31 frames)
animation tick: 0.1% (avg: 0.1 ms, worst: 0 ms)
flush: 4.9% (avg: 5.0 ms, worst: 6 ms)
repaint: 7.2% (avg: 7.3 ms, worst: 42 ms)
  prepare: 0.5% (avg: 0.5 ms, worst: 1 ms)
  region compute: 0.0% (avg: 0.0 ms, worst: 0 ms)
  paint: 6.5% (avg: 6.6 ms, worst: 41 ms)
    spark scale change: 0.1% (avg: 0.1 ms, worst: 3 ms)
    spark glyph retrieval: 0.1% (avg: 0.1 ms, worst: 2 ms)
    text layout: 0.8% (avg: 0.8 ms, worst: 14 ms)
    text blend: 0.8% (avg: 0.8 ms, worst: 4 ms)
    rect blend: 1.8% (avg: 1.8 ms, worst: 9 ms)
    rect fill: 1.0% (avg: 1.1 ms, worst: 3 ms)
    image blend: 1.3% (avg: 1.3 ms, worst: 9 ms)
      alpha w/color: 0.3% (avg: 0.3 ms, worst: 0 ms)
      alpha: 0.9% (avg: 0.9 ms, worst: 8 ms)
      opaque: 0.1% (avg: 0.1 ms, worst: 1 ms)
The first three lines show the heap and stack usage of the application.
Followed by, the current usage and total capacity of the resource (image), text, and Monotype Spark font engine caches, respectively.
Next up, is the information about how many frames took one, two or three refresh (vsync) intervals to render. In order to consistently render at 60 frames per second, all frames must finish rendering within a single refresh intreval.
The "10 fps" line (last 31 frames) means that these statistics are for the previous 31 frames, with an average of 10 frames per second.
Finally, there are the timing statistics for various parts of the Qt Quick Ultralite rendering pipeline. The "avg" value represents the average time spent on a certain frame, whereas the "worst" value represents the longest time spent on a single frame. Here's an overview about the different timing statistics that you may see in the log:
| Entry | Description |
|---|---|
| animation tick | Time spent on advancing all the QML animations, such as NumberAnimation. |
| flush | Time spent in the beginFrame() and presentFrame() member functions in Qul::Platform::PlatformContext. It mainly indicates the time spent waiting for vertical refresh. A lot of time spent here does not indicate that the application is performing poorly, but rather means that there is a lot of free time, which is not used to prepare or render the frame. |
| repaint | Time spent on preparing and painting the areas that change during the animation. |
| prepare | Time spent preparing render nodes for the QML items. This includes identifying the bounding rectangles for the QML items that are currently visible. |
| region compute | Time spent on computing the dirty regions for each frame, based on the bounding rectangles of the visible items. |
| opacity compute | Time spent on computing opaque areas to reduce overdraw if possible. |
| paint | Overall time spent on painting all the visible items. |
| spark scale change | Time spent in Monotype Spark font engine to prepare for a pixel size change. |
| spark glyph retrieval | Rasterizing glyphs in the Monotype Spark font engine, that are then kept in the font engine cache. |
| cpu access sync | Time spent syncing for CPU access when using the fallback drawing engine. |
| text layout | Time spent to lay out text, which then gets drawn directly onto the framebuffer or into the text cache. |
| text blend | Time spent on blending the text, either individually glyph-by-glyph or using the text cache. |
| rect blend | Time spent blending semi-transparent rectangles (the Rectangle QML type). |
| rect fill | Time spent blitting the opaque rectangles (the Rectangle QML type). |
| rect rounded | Time spent blending the rounded rectangles (the Rectangle QML type, with a radius set). |
| image transform | Overall time spent on blending transformed (scaled, rotated, skewed, and projected) images. |
| image blend | Overall time spent on blending non-transformed images. |
| alpha w/color | Time spent blending images that use the PixelFormat_Alpha8 format, combined with a color (for example using ColorizedImage). |
| alpha | Time spent blending images with an alpha channel (PixelFormat_ARGB32, PixelFormat_ARGB4444, and so on). |
| opaque | Time spent blending images with an alpha channel (PixelFormat_ARGB32, PixelFormat_ARGB4444, and so on). |
| path blend | Time spent blending paths from the QML Shape API or text using vector outlines. |
CPU usage
To see the Qt Quick Ultralite CPU usage on platforms that support it, rebuild the Qt Quick Ultralite platform library with the -DQUL_ENABLE_HARDWARE_PERFORMANCE_LOGGING=on CMake option.
CPU load information is shown on the serial output like this:
CPU Load: 44.47
This example means a CPU load of 44.47 %. The CPU was idle slightly more than half of the time.
Note: On the reference platforms that support this feature, CPU usage is estimated based on CPU idle time.
Memory footprint
Footprint information is important when determining how much RAM and flash memory is needed by the application or when attempting to reduce the size of the binary. You can obtain footprint information of Qt Quick Ultralite application using the tools provided by the supported toolchains and Resource cache application.
Tools
Toolchain-specific tools can be used to determine the memory consumption by the application binary. These tools have different flags and produce different outputs. The following subsections list these tools offered by the three toolchains supported by Qt for MCUs: ARM GCC, IAR and GHS.
ARM GCC
ARM GCC includes two separate tools that can be used to determine the memory consumption of the application: size and readelf. These can be found in the ARM GCC installation folder under the bin directory. The binaries are prefixed with arm-none-eabi-, for example the size binary is named as arm-none-eabi-size. They are also part of the GNU Binutils package which can be found in many Linux distributions.
size is a utility that lists the section sizes of a binary or an archive. The section sizes can be displayed in various formats:
- SystemV format (
-Aor--format=sysv) This format shows all the sections and their sizes as list. It is recommended to use SystemV format to get a good overview of the sections contained in the binary and their sizes and addresses. - Berkeley format (
-Bor--format=berkeley) The default format of GNU size. The Berkeley format counts read only data in thetextcolumn, not in thedatacolumn, thedecandhexcolumns both display the sum of thetext,data, andbsscolumns in decimal and hexadecimal respectively. - GNU format (
-Gor--format=gnu) The GNU format counts read only data in thedatacolumn, not thetextcolumn, and only displays the sum of thetext,data, andbsscolumns once, in thetotalcolumn. The--radixoption can be used to change the number base for all columns.
readelf is a tool for displaying information about ELF format object files. It can be used to gather a wide variety of information from a binary, such as section sizes, program headers, and symbols. To measure the footprint of the application, use flag -S, --section-headers, or --sections to get information about all the sections, their sizes, and other useful information.
In addition, the -Wl,--print-memory-usage compiler flag can be used. The linker will then print all the memory regions configured in the linker script, their actual size, and the used size both in bytes and as a percentage.
Note: Using -Wl,--print-memory-usage does not show section sizes so it cannot be used to show the size of the QulResourceData section for example.
IAR
IAR toolchain offers ielfdumparm, which is used to create a text representation of the contents of an ELF file. It is located in the IAR installation directory, in arm/bin. To get information about sectors and segments contained in the binary, run ielfdumparm <input>.
Another way to get information about different sections is to use the --map flag in the linker. This produces a linker memory map file, which contains detailed information about sections and where they are placed in memory.
Note: The qul_add_target Qt Quick Ultralite CMake macro adds --map to the target's linker options automatically. The resulting memory map can be found in the same location where the target binary is. The filename of the map is <target>.map.
For more information about ielfdumparm or the usage of --map linker option, see IAR C/C++ Development Guide.
GHS
The GHS toolchain has the gsize utility for measuring section sizes. It can be found in the GHS compiler installation directory. gsize analyzes the binary and outputs the sections and their sizes. If -all flag is given, it also lists all sections with size 0.
The GHS linker elxr offers the option -map which outputs a separate <target>.map file to the same location where the target binary is generated. This file contains extensive information about the target binary, including sections contained in the binary and their sizes. This linker option is enabled by default, but it can be changed by specifying -map=<filename> or even -nomap. These options allow changing the location where the map file is output or disable the map file generation altogether.
For more information about gsize or the usage of -map linker option, see MULTI: Building Applications for Embedded ARM (or similar depending on the target architecture) documentation.
Flash memory usage
By default, Qt Quick Ultralite has three resource sections which are placed in the flash memory. The QulFontResourceData, QulResourceData, and QulModuleResourceData sections are used to store font assets, image assets, and Qt Quick Ultralite internal resources respectively. More information on these sections can be found from Resource placement in memory and Linker script setup.
To obtain the size of these sections, use the tools mentioned in the Tools section. The output of these tools should look similar to the output of size -A minimal.elf:
section                     size         addr
.flash_config                512    805307392
.ivt                        1336    805310464
.interrupts                 1024    805314560
.text                     347552    805315584
CodeQuickAccess               56    805663136
.ARM                           8    805663192
.init_array                    8    805663200
.fini_array                    8    805663208
.data                        236   2147483648
.ncache.init                   0   2197815296
.ncache                  2097152   2197815296
.bss                       13104   2147483888
QulFontResourceData        21736    805663456
QulModuleResourceData          0   2147496992
QulResourceData                0    805685192
QulPreprocessCache        524288   2147496992
.heap                          0   2148021280
.ARM.attributes               46            0
.debug_info              5402684            0
.debug_abbrev             253660            0
.debug_loc                871154            0
.debug_aranges             12520            0
.debug_ranges             100040            0
.debug_line               908143            0
.debug_str               3705172            0
.comment                      73            0
.debug_frame               51112            0
.debug_macro              570227            0
.stab                         60            0
.stabstr                     118            0
Total                   14882029
Note: Section names may vary depending on the linker script used.
Estimating RAM usage
A Qt Quick Ultralite application needs RAM for the following:
- Framebuffer
- Stack
- Heap
- Caches (for text, font engine, and images)
- Resources
- Qul item data
The following sections explain how to estimate or gather memory footprint information from these items.
Framebuffer
The framebuffer size for a rectangular screen can be estimated with the following formula:
Framebuffer size in bytes = width x height x bytes per pixel x number of buffers
Where
widthis the width of the screen in pixelsheightis the height of the screen in pixelsbytes per pixelis the number of bytes used for each pixel. If the bit depth is known, bytes per pixel can be calculated by dividing bit depth by 8. For a 32bpp framebuffer the bytes per pixel value is32 / 8 = 4.number of buffersdepends on the buffering strategy used. For single buffering the value should be 1 and for double buffering it should be 2.
This size estimation may vary if the framebuffer used for the screen is not rectangular. In this case width x height in the earlier formula can be substituted with the total number of pixels in the framebuffer.
For more information about framebuffers and their requirements, see Framebuffer Requirements.
Stack and heap
Qt Quick Ultralite (Platform) offers two functions for printing stack and heap statistics: Qul::Platform::printStackStats and Qul::Platform::printHeapStats. To use these functions, they must be implemented in the platform code. See memory statistics for more information on how to implement these functions.
Resource cache
A typical Qt Quick Ultralite application can have following types of caches:
For the best tradeoff between memory usage and performance it might be important to tweak the sizes of these caches. Here are some guidelines for estimating their appropriate sizes for your application:
Text cache
For the text cache, the ideal size depends on how much text is on the screen and on the pixel size of the text. For example, the "Qt for MCUs" text with a pixel size of 30 in the Qt Quick Ultralite minimal Example consumes 6899 bytes. The bounding rectangle of the glyphs required to draw the Text item is 183 pixels wide and 37 pixels high.
As you need one byte per pixel to represent the opacity of the text, the number of bytes needed for its alpha map can be computed as follows:
183 x 37 = 6771 bytes
Additionally, each cache entry includes a small amount of metadata, which is why the final required amount is slightly higher.
For ideal performance, an application with a single page should at least have a text cache that is big enough to accommodate all text on that page. If 10% of the page is covered by text and the screen resolution is 800x480, 800 x 480 x 10% = 38.4 Kb text cache should be sufficient.
If there are two or more pages and a fading transition animation between them, the ideal text cache size should be able to fit the text of both pages.
A smaller text cache could be used to trade sacrifice some performance for lower memory usage, although it could mean that some text cache entries need to be regenerated each frame during animations or transitions. With the Monotype Spark font engine the cost of generating the text cache entries will be higher than with the static font engine, so it might be particularly important to keep the text cache size big enough if there are performance issues.
Another thing to note is that if Text items are destroyed and recreated, the associated text cache entry will also be automatically regenerated once the Text item is visible. Changing the text or any other properties that affect its appearance, will also invalidate the text cache entry.
Refer to the Text Rendering And Fonts page for more information about text cache size.
The text cache size used by the application can be seen by looking at the the Qt Quick Ultralite performance logs.
Font engine cache
The Monotype Spark font engine uses the font engine cache for alpha maps of each glyph that is rasterized. If the cache is big enough, the glyph is rasterized only once instead of each draw (either into text cache or onto the framebuffer, if text cache is disabled).
For example, the Qt Quick Ultralite Thermostat Demo needs at least 50 Kb font engine cache to keep all the alpha maps for a single language, on a 800x480 resolution.
With a big enough text cache, the font engine cache is accessed the first time a Text item is shown or whenever the text changes. However, the text cache might be accessed on each rendered frame when animations are running. Therefore, for the sake of performance it's usually better to use more memory for the text cache than for the font engine cache. On the other hand, the font engine cache is more memory efficient as caching is done per-glyph, and the same glyph might appear multiple times in different Text items if the same character is being used.
If MCU.Config.fontVectorOutlinesDrawing is enabled, the font engine cache is used for CMAP and Advance caches only, and not for the vector outlines. Therefore, it can be kept relatively small, whereas the text cache should be kept reasonably large to avoid regenerating the vector outlines.
Refer to the Text Rendering And Fonts page for more information about font engine cache size.
The font engine cache size used by the application can be seen by looking at the Qt Quick Ultralite performance logs.
Image cache
The image cache should be big enough to fit all the images (with OnDemand cache policy) that are visible at the same time on the screen. Otherwise large images might be cycled in and out of RAM several times per frame, impacting performance significantly. This especially applies if ImageFiles.MCU.resourceCompression is enabled, which adds the additional overhead of decompressing the image before loading it to the image cache.
For example, an application that transitions between two pages, one that contains two 200x200 images, and another that contains one 320x200 image. If the color depth of the images is 32 bits (4 bytes) per pixel, the ideal size for the image cache can be computed as follows:
Cache size (with transition) = 2 x 200 x 200 x 4 + 320 x 200 x 4 = 576000 bytes
This ensures that a transition animation between the two pages is smooth. If there's no transition animation, the page with the biggest size requirement can be used:
Cache size (without transition) = 2 x 200 x 200 x 4 = 320000 bytes
Refer to the Image Caching page for more information about the image cache size.
The image cache size used by the application can be seen by looking at the Qt Quick Ultralite performance logs.
RAM usage by preloaded resources
The amount of RAM consumed by preloaded resources depends on how the resource preloading is configured in your project. By default, all image, font, and Qt Quick Ultralite item data resources are preloaded into RAM during application startup. With this option the RAM usage of the preloaded resources can be high for all the Qt Quick Ultralite resource sections combined (without ImageFiles.MCU.resourceCompression). See Flash memory usage on how to obtain the sizes of Qt Quick Ultralite resource sections.
The behavior can be controlled by setting the QmlProject property ImageFiles.MCU.resourceCachePolicy. It can also be set for individual resources if defined in ImageFiles or the at preload of all resources if defined in MCU.Config See ImageFiles.MCU.resourceCachePolicy for information on ImageFiles.MCU.resourceCachePolicy and possible values the variable takes.
Available under certain Qt licenses.
Find out more.