QML Video Shader Effects Example
Files:
- video/qmlvideofx/filereader.cpp
- video/qmlvideofx/filereader.h
- video/qmlvideofx/qmlvideofx.svg
- video/qmlvideofx/trace.h
- video/qmlvideofx/qml/qmlvideofx/Button.qml
- video/qmlvideofx/qml/qmlvideofx/Content.qml
- video/qmlvideofx/qml/qmlvideofx/ContentCamera.qml
- video/qmlvideofx/qml/qmlvideofx/ContentImage.qml
- video/qmlvideofx/qml/qmlvideofx/ContentVideo.qml
- video/qmlvideofx/qml/qmlvideofx/DisableScreenSaver.qml
- video/qmlvideofx/qml/qmlvideofx/Divider.qml
- video/qmlvideofx/qml/qmlvideofx/Effect.qml
- video/qmlvideofx/qml/qmlvideofx/EffectBillboard.qml
- video/qmlvideofx/qml/qmlvideofx/EffectBlackAndWhite.qml
- video/qmlvideofx/qml/qmlvideofx/EffectEmboss.qml
- video/qmlvideofx/qml/qmlvideofx/EffectGaussianBlur.qml
- video/qmlvideofx/qml/qmlvideofx/EffectGlow.qml
- video/qmlvideofx/qml/qmlvideofx/EffectIsolate.qml
- video/qmlvideofx/qml/qmlvideofx/EffectMagnify.qml
- video/qmlvideofx/qml/qmlvideofx/EffectPageCurl.qml
- video/qmlvideofx/qml/qmlvideofx/EffectPassThrough.qml
- video/qmlvideofx/qml/qmlvideofx/EffectPixelate.qml
- video/qmlvideofx/qml/qmlvideofx/EffectPosterize.qml
- video/qmlvideofx/qml/qmlvideofx/EffectRipple.qml
- video/qmlvideofx/qml/qmlvideofx/EffectSelectionPanel.qml
- video/qmlvideofx/qml/qmlvideofx/EffectSepia.qml
- video/qmlvideofx/qml/qmlvideofx/EffectSharpen.qml
- video/qmlvideofx/qml/qmlvideofx/EffectShockwave.qml
- video/qmlvideofx/qml/qmlvideofx/EffectSobelEdgeDetection1.qml
- video/qmlvideofx/qml/qmlvideofx/EffectSobelEdgeDetection2.qml
- video/qmlvideofx/qml/qmlvideofx/EffectTiltShift.qml
- video/qmlvideofx/qml/qmlvideofx/EffectToon.qml
- video/qmlvideofx/qml/qmlvideofx/EffectVignette.qml
- video/qmlvideofx/qml/qmlvideofx/EffectWarhol.qml
- video/qmlvideofx/qml/qmlvideofx/EffectWobble.qml
- video/qmlvideofx/qml/qmlvideofx/FileBrowser.qml
- video/qmlvideofx/qml/qmlvideofx/FileOpen.qml
- video/qmlvideofx/qml/qmlvideofx/HintedMouseArea.qml
- video/qmlvideofx/qml/qmlvideofx/ParameterPanel.qml
- video/qmlvideofx/qml/qmlvideofx/Slider.qml
- video/qmlvideofx/qml/qmlvideofx/main-largescreen.qml
- video/qmlvideofx/qml/qmlvideofx/main-smallscreen.qml
- video/qmlvideofx/qmlapplicationviewer/qmlapplicationviewer.cpp
- video/qmlvideofx/qmlapplicationviewer/qmlapplicationviewer.h
- video/qmlvideofx/main.cpp
- video/qmlvideofx/qmlvideofx.pro
- video/qmlvideofx/qmlvideofx.qrc
Images:
- video/qmlvideofx/images/close.png
- video/qmlvideofx/images/folder.png
- video/qmlvideofx/images/qt-logo.png
- video/qmlvideofx/images/titlebar.png
- video/qmlvideofx/images/up.png
The QML Video Shader Effects Example shows how the ShaderEffectItem element can be used to apply postprocessing effects, expressed in GLSL, to QML Video and Camera items.
Overview
This example shows how the ShaderEffectItem element can be used to apply postprocessing effects, expressed in GLSL, to QML Video and Camera items.
It also shows how native code can be combined with QML to implement more advanced functionality - in this case, C++ code is used to calculate the QML frame rate and (on Symbian) the graphics memory consumption; these metrics are rendered in QML as semi-transparent items overlaid on the video content.
Finally, this application demonstrates the use of different top-level QML files to handle different physical screen sizes. On small-screen devices, menus are by default hidden, and only appear when summoned by a gesture. Large-screen devices show a more traditional layout in which menus are displayed around the video content pane.
The following screenshots show shader effects being applied. In each case, the effect is implemented using a fragment shader.
Here we see an edge detection algorithm being applied to a video clip (Elephant's Dream from blender.org).

This image shows a page curl effect, applied to the same video clip.

Here we see a 'glow' effect (edge detection plus colour quantization) being applied to the camera viewfinder.

This image shows a 'lens magnification' effect applied to the viewfinder.

The application includes many more effects than the ones shown here - look for Effect*.qml files in the list above to see the full range.
Application structure
Shader effects can be applied to video or viewfinder content using the ShaderEffectItem element, as shown in the following example, which applies a wiggly effect to the content:
 import QtQuick 1.0
 import Qt.labs.shaders 1.0

 Rectangle {
     width: 300
     height: 300
     color: "black"

     Video {
         id: video
         anchors.fill: parent
         source: "test.mp4"
     }

     ShaderEffectItem {
         property variant source: ShaderEffectSource { sourceItem: video; hideSource: true }
         property real wiggleAmount: 0.005
         anchors.fill: video

         fragmentShader: "
             varying highp vec2 qt_TexCoord0;
             uniform sampler2D source;
             uniform highp float wiggleAmount;
             void main(void)
             {
                 highp vec2 wiggledTexCoord = qt_TexCoord0;
                 wiggledTexCoord.s += sin(4.0 * 3.141592653589 * wiggledTexCoord.t) * wiggleAmount;
                 gl_FragColor = texture2D(source, wiggledTexCoord.st);
             }
         "
     }
 }
In this application, the usage of the ShaderEffectItem, Video and Camera elements is a bit more complicated, for the following reasons:
- Each effect can be applied to either a Video, a Camera or a Image item, so the type of the source item must be abstracted away from the effect implementation
- For some effects (such as the edge detection and glow examples shown in the screenshots above), the transformation is applied only to pixels to the left of a dividing line - this allows the effect to be easily compared with the untransformed image on the right
- Most effects have one or more parameters which can be modified by the user - these are controlled by sliders in the UI which are connected to uniform values passed into the GLSL code
The abstraction of source item type is achieved by the Content element, which uses a Loader to create either a Video, Camera or Image element:
 import QtQuick 1.0
 import Qt.labs.shaders 1.0

 Rectangle {
     ...
     Loader {
         id: contentLoader
     }

     ...
     function openImage(path) {
         console.log("[qmlvideofx] Content.openImage \"" + path + "\"")
         stop()
         contentLoader.source = "ContentImage.qml"
         contentLoader.item.source = path
     }

     function openVideo(path) {
         console.log("[qmlvideofx] Content.openVideo \"" + path + "\"")
         stop()
         contentLoader.source = "ContentVideo.qml"
         contentLoader.item.source = path
     }

     function openCamera() {
         console.log("[qmlvideofx] Content.openCamera")
         stop()
         contentLoader.source = "ContentCamera.qml"
     }

 }
Each effect is implemented as a QML item which is based on the Effect element, which in turn is based on the ShaderEffectItem element:
 import QtQuick 1.0
 import Qt.labs.shaders 1.0

 ShaderEffectItem {
     property variant source
     property ListModel parameters: ListModel { }
     property bool divider: true
     property real dividerValue: 0.5
     property real targetWidth: 0
     property real targetHeight: 0
     property string fragmentShaderFilename
     property string vertexShaderFilename

     QtObject {
         id: d
         property string fragmentShaderCommon: "
             #ifdef GL_ES
                 precision mediump float;
             #else
             #   define lowp
             #   define mediump
             #   define highp
             #endif // GL_ES
         "
     }

     // The following is a workaround for the fact that ShaderEffectItem
     // doesn't provide a way for shader programs to be read from a file,
     // rather than being inline in the QML file

     onFragmentShaderFilenameChanged:
         fragmentShader = d.fragmentShaderCommon + fileReader.readFile(fragmentShaderFilename)
     onVertexShaderFilenameChanged:
         vertexShader = fileReader.readFile(vertexShaderFilename)
 }
The interface of the Effect element allows for derived effects to specify the number of parameters which they support (and therefore the number of sliders which should be displayed), and whether a vertical dividing line should be drawn between transformed and untransformed image regions. As an example, here is the implementation of the pixelation effect. As you can see, the pixelation effect supports one parameter (which controls the pixelation granularity), and states that the divider should be displayed.
 import QtQuick 1.0

 Effect {
     parameters: ListModel {
         ListElement {
             name: "granularity"
             value: 0.5
         }
     }

     // Transform slider values, and bind result to shader uniforms
     property real granularity: parameters.get(0).value * 20

     fragmentShaderFilename: "shaders/pixelate.fsh"
 }
The main.qml file shows a FileOpen element which allows the user to select the input source and an EffectSelectionPanel item, which lists each of the available shader effects. As described above, a Content item is used to load the appropriate input and effect element. A Divider item draws the vertical dividing line, which can be dragged left / right by the user. Finally, a ParameterPanel item renders the sliders corresponding to each effect parameter.
Here is the source selection menu:

And here is the effect selection menu:

Calculating and displaying QML painting rate
The QML painting rate is calculated by first creating a QObject-derived class called PaintEventMonitor, which allows its client to provide a QWidget to be monitored, and which emits a signal when that widget is repainted:
 class PaintEventMonitor : public QObject
 {
     Q_OBJECT
     Q_PROPERTY(QWidget *target READ target WRITE setTarget NOTIFY targetChanged)
     ...
 protected:
     bool eventFilter(QObject *object, QEvent *event);

 signals:
     void targetPainted();

 private:
     QWidget *m_target;
 };
The signal is generated by installing an event filter on the target QWidget:
 bool PaintEventMonitor::eventFilter(QObject *object, QEvent *event)
 {
     if (m_target == object && event->type() == QEvent::Paint)
         emit targetPainted();
     return QObject::eventFilter(object, event);
 }
A second class, FrequencyMonitor, is used to turn the stream of targetPainted() signals into an instantaneous and an averaged frequency:
 class FrequencyMonitor : public QObject
 {
     Q_OBJECT
     Q_PROPERTY(qreal instantaneousFrequency READ instantaneousFrequency NOTIFY instantaneousFrequencyChanged)
     Q_PROPERTY(qreal averageFrequency READ averageFrequency NOTIFY averageFrequencyChanged)
 public:
     ...
     static void qmlRegisterType();

 public slots:
     Q_INVOKABLE void notify();
 };
The FrequencyMonitor class is exposed to QML like this
 void FrequencyMonitor::qmlRegisterType()
 {
     ::qmlRegisterType<FrequencyMonitor>("FrequencyMonitor", 1, 0, "FrequencyMonitor");
 }
and its data is displayed by defining a QML item called FrequencyItem, like this:
 import FrequencyMonitor 1.0

 Rectangle {
     id: root
     ...
     function notify() {
         monitor.notify()
     }

     FrequencyMonitor {
         id: monitor
         onAverageFrequencyChanged: {
The result looks like this:

All that remains is to create a PaintEventMonitor in the C++ main() function, tell it to monitor the QML viewport widget, and to connect its framePainted() signal to a JavaScript function, which will eventually call frequencyItem.notify():
     QmlApplicationViewer viewer;

     ...
     QGraphicsObject *rootObject = viewer.rootObject();
     ...
     PaintEventMonitor paintEventMonitor;
     paintEventMonitor.setTarget(viewer.viewport());
     QObject::connect(&paintEventMonitor, SIGNAL(targetPainted()),
                      rootObject, SLOT(qmlFramePainted()));
Querying and displaying graphics memory consumption
On Symbian, graphics memory consumption is an important consideration, because many of the current devices have a limited amount of graphics memory, which is shared by both the graphics stack (for OpenGLES / OpenVG rendering) and the camera/video stack. For this reason, being able to track the amount of graphics memory being consumed by a given use case can be useful during application development. This application demonstrates how this can be done, by using some native code to query graphics memory consumption information from a platform API, and a QML element to display this on screen in an overlay item.
Starting with Symbian Anna, the platform implements an EGL extension called EGL_NOK_resource_profiling. This allows the client to query
- Total graphics memory
- Total currently used graphics memory
- Graphics memory used by calling process
Being an EGL extension, this API isn't particularly friendly to use, so this example provides a simple Qt wrapper:
 class GraphicsMemoryMonitor : public QObject
 {
     Q_OBJECT
     Q_DECLARE_PRIVATE(GraphicsMemoryMonitor)
     Q_PROPERTY(bool active READ active NOTIFY activeChanged)
     Q_PROPERTY(qint64 totalMemory READ totalMemory NOTIFY totalMemoryChanged)
     Q_PROPERTY(QString totalMemoryHumanReadable READ totalMemoryHumanReadable NOTIFY totalMemoryHumanReadableChanged)
     Q_PROPERTY(qint64 usedMemory READ usedMemory NOTIFY usedMemoryChanged)
     Q_PROPERTY(QString usedMemoryHumanReadable READ usedMemoryHumanReadable NOTIFY usedMemoryHumanReadableChanged)
     Q_PROPERTY(qint64 availableMemory READ availableMemory NOTIFY availableMemoryChanged)
     Q_PROPERTY(QString availableMemoryHumanReadable READ availableMemoryHumanReadable NOTIFY availableMemoryHumanReadableChanged)
     Q_PROPERTY(qint64 currentProcessUsage READ currentProcessUsage NOTIFY currentProcessUsageChanged)
     Q_PROPERTY(QString currentProcessUsageHumanReadable READ currentProcessUsageHumanReadable NOTIFY currentProcessUsageHumanReadableChanged)
     Q_PROPERTY(qint64 updateInterval READ updateInterval WRITE setUpdateInterval NOTIFY updateIntervalChanged)
     ...
     };
This class is exposed to QML like this:
 void GraphicsMemoryMonitor::qmlRegisterType()
 {
     ::qmlRegisterType<GraphicsMemoryMonitor>("GraphicsMemoryMonitor", 1, 0, "GraphicsMemoryMonitor");
 }
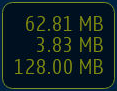
And then the information is displayed by the GraphicsMemoryItem element:
 import QtQuick 1.0
 import GraphicsMemoryMonitor 1.0

 Rectangle {
     id: root
     property bool logging: true
     property bool displayed: true
     property bool enabled: logging || displayed
     property int updateInterval: 500
     property color textColor: "yellow"
     property int textSize: 20

     border.width: 1
     border.color: "yellow"
     width: 5.6 * root.textSize
     height: 4.3 * root.textSize
     color: "black"
     opacity: 0.5
     radius: 10
     visible: displayed && monitor.active

     // This should ensure that the monitor is on top of all other content
     z: 999

     GraphicsMemoryMonitor {
         id: monitor
         updateInterval: root.enabled ? root.updateInterval : 0
         onChanged: if (root.logging) trace()
     }

     Text {
         anchors {
             right: parent.right
             top: parent.top
             margins: 10
         }
         color: root.textColor
         font.pixelSize: root.textSize
         text: monitor.usedMemoryHumanReadable
     }

     Text {
         anchors {
             right: parent.right
             verticalCenter: parent.verticalCenter
             margins: 10
         }
         color: root.textColor
         font.pixelSize: root.textSize
         text: monitor.currentProcessUsageHumanReadable
     }

     Text {
         anchors {
             right: parent.right
             bottom: parent.bottom
             margins: 10
         }
         color: root.textColor
         font.pixelSize: root.textSize
         text: monitor.totalMemoryHumanReadable
     }
 }
The result looks like this: