
PolarView QML Type
Draws series on a polar coordinate system. More...
| Import Statement: | import QtGraphs |
| Since: | Qt 6.13 |
| Inherits: |
- List of all members, including inherited members
- PolarView is part of Qt Graphs QML Types for 2D.
Properties
- labelPadding : real
- polarCenter : point
- polarRadius : real
Detailed Description
PolarView plots series on a polar coordinate system instead of the Cartesian one that GraphsView uses. It reinterprets axisX as the angular axis and axisY as the radial axis.
The angular axis maps its full range to one complete revolution, starting at the top of the graph and advancing clockwise. The radial axis maps its minimum to the center of the graph and its maximum to the outer edge. Values below the radial minimum collapse onto the center.
PolarView supports LineSeries, ScatterSeries, SplineSeries, and AreaSeries. Adding any other series type prints a warning and leaves the graph unchanged. A polar view also rejects BarCategoryAxis and ColorAxis.
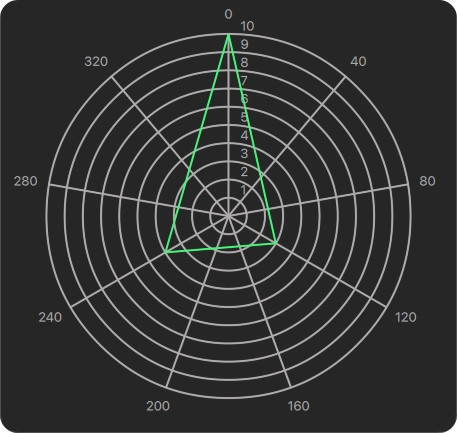
The following example code illustrates how to use the PolarView type:
PolarView {
    anchors.fill: parent
    labelPadding: 12
    axisX: ValueAxis { min: 0; max: 360 }   // angular
    axisY: ValueAxis { min: 0; max: 10 }    // radial

    LineSeries {
        color: "#46f477"
        width: 2

        XYPoint { x: 0; y: 10 }
        XYPoint { x: 120; y: 3 }
        XYPoint { x: 240; y: 4 }
        XYPoint { x: 360; y: 10 }
    }
}
The image below illustrates the result:
See also GraphsView, LineSeries, ScatterSeries, SplineSeries, AreaSeries, and ValueAxis.
Property Documentation
labelPadding : real
The gap, in pixels, between the axis grid (the outer ring for angular labels, or the ring belonging to a given tick for radial labels) and the axis label items placed next to it. The default value is 8.
polarCenter : point [read-only]
The center of the polar plot, in the coordinate space of the plot area.
Use this property together with polarRadius to position gradients or custom items on top of the graph. The default value is Qt.point(0, 0).
polarRadius : real [read-only]
The radius of the polar plot, in pixels.
The radius is half the side of the largest square that fits the plot area, after subtracting the space that the radial axis labels need. The default value is 0.
© 2026 The Qt Company Ltd. Documentation contributions included herein are the copyrights of their respective owners. The documentation provided herein is licensed under the terms of the GNU Free Documentation License version 1.3 as published by the Free Software Foundation. Qt and respective logos are trademarks of The Qt Company Ltd. in Finland and/or other countries worldwide. All other trademarks are property of their respective owners.
