- class QAreaSeries#
The
QAreaSeriesclass presents data in area charts. More…Synopsis#
Properties#
borderColorᅟ- Line (pen) color of the series. This is a convenience property for modifying the color of the pencolorᅟ- Fill (brush) color of the series. This is a convenience property for modifying the color of the brushpointLabelsClippingᅟ- Clipping for data point labels. True by default. The labels on the edge of the plot area are cut when clipping is enabledpointLabelsColorᅟ- Color used for data point labels. By default, the color is the color of the brush defined for labels in the themepointLabelsFontᅟ- Font used for data point labelspointLabelsFormatᅟ- Format used for showing labels with series pointspointLabelsVisibleᅟ- Visibility of data point labels. False by default
Methods#
def
__init__()def
borderColor()def
brush()def
color()def
pen()def
pointsVisible()def
setBorderColor()def
setBrush()def
setColor()def
setPen()
Signals#
def
clicked()def
colorChanged()def
doubleClicked()def
hovered()def
pressed()def
released()def
selected()
Note
This documentation may contain snippets that were automatically translated from C++ to Python. We always welcome contributions to the snippet translation. If you see an issue with the translation, you can also let us know by creating a ticket on https:/bugreports.qt.io/projects/PYSIDE
Detailed Description#
An area series is used to show quantitative data. It is based on a line series, in the way that the area between the boundary lines is emphasized with color. Since the area series is based on the line series, the
QAreaSeriesconstructor needs aQLineSeriesinstance, which defines the upper boundary of the area. The area chart is drawn using the bottom of the plot area as the lower boundary by default. Instead of the bottom of the plot area, the lower boundary can be specified by another line. In that case,QAreaSeriesshould be initialized with twoQLineSeriesinstances.Note
The terms upper and lower boundary can be misleading in cases where the value of the lower boundary is greater than that of the upper boundary. The main point is that the area between these two boundary lines will be filled.
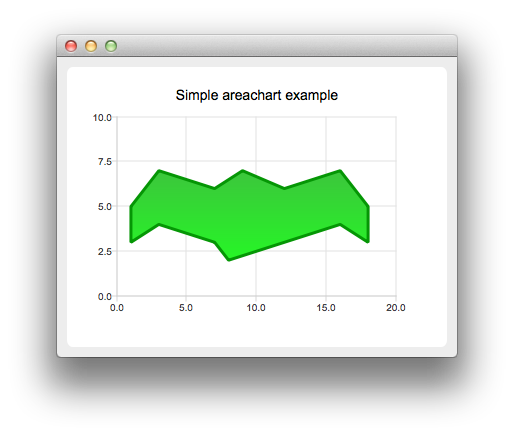
See the Charts with Widgets Gallery to learn how to create a simple area chart.
Note
Properties can be used directly when
from __feature__ import true_propertyis used or via accessor functions otherwise.This property holds The line (pen) color of the series. This is a convenience property for modifying the color of the pen..
See also
- Access functions:
This property holds The fill (brush) color of the series. This is a convenience property for modifying the color of the brush..
See also
- Access functions:
Signal
colorChanged()
- property pointLabelsClippingᅟ: bool#
This property holds The clipping for data point labels. True by default. The labels on the edge of the plot area are cut when clipping is enabled..
See also
- Access functions:
This property holds The color used for data point labels. By default, the color is the color of the brush defined for labels in the theme..
See also
- Access functions:
This property holds The font used for data point labels..
See also
- Access functions:
- property pointLabelsFormatᅟ: str#
This property holds The format used for showing labels with series points..
QAreaSeriessupports the following format tags:@xPoint
The x value of the data point
@yPoint
The y value of the data point
For example, the following usage of the format tags would produce labels that have the data point (x, y) shown inside brackets separated by a comma:
series->setPointLabelsFormat("(@xPoint, @yPoint)");
By default, the label format is set to
@xPoint, @yPoint. The labels are shown on the plot area, whereas labels on the edge of the plot area are cut. If the points are close to each other, the labels may overlap.- Access functions:
- property pointLabelsVisibleᅟ: bool#
This property holds The visibility of data point labels. False by default..
See also
- Access functions:
Constructs an area series object without an upper or a lower series with the
parentobject.- borderColor()#
- Return type:
See also
Getter of property
borderColorᅟ.This signal is emitted when the line (pen) color changes to
color.Notification signal of property
borderColorᅟ.Returns the brush used to draw the line for this series.
See also
This signal is emitted when the user triggers a press on
pointby clicking it in an area chart.See also
- color()#
- Return type:
See also
Getter of property
colorᅟ.This signal is emitted when the fill (brush) color changes to
color.Notification signal of property
colorᅟ.This signal is emitted when the user triggers the first press in an area chart by doubleclicking
point.This signal is emitted when the user hovers the mouse cursor over a series or moves it away from the series.
pointshows the origin (coordinate) of the hover event.stateistruewhen the cursor hovers over the series and turns false when it moves away from the series.Returns the pen used to draw the line for this series.
See also
- pointLabelsClipping()#
- Return type:
bool
See also
Getter of property
pointLabelsClippingᅟ.- pointLabelsClippingChanged(clipping)#
- Parameters:
clipping – bool
This signal is emitted when the clipping of the data point labels changes to
clipping.Notification signal of property
pointLabelsClippingᅟ.- pointLabelsColor()#
- Return type:
See also
Getter of property
pointLabelsColorᅟ.This signal is emitted when the color used for data point labels changes to
color.Notification signal of property
pointLabelsColorᅟ.- pointLabelsFont()#
- Return type:
See also
Getter of property
pointLabelsFontᅟ.This signal is emitted when the font used for data point labels changes to
font.Notification signal of property
pointLabelsFontᅟ.- pointLabelsFormat()#
- Return type:
str
See also
Getter of property
pointLabelsFormatᅟ.- pointLabelsFormatChanged(format)#
- Parameters:
format – str
This signal is emitted when the
formatof data point labels is changed.Notification signal of property
pointLabelsFormatᅟ.- pointLabelsVisibilityChanged(visible)#
- Parameters:
visible – bool
This signal is emitted when the visibility of the data point labels changes to
visible.Notification signal of property
pointLabelsVisibleᅟ.- pointLabelsVisible()#
- Return type:
bool
See also
Getter of property
pointLabelsVisibleᅟ.- pointsVisible()#
- Return type:
bool
Returns whether the points are drawn for this series.
See also
This signal is emitted when the user presses the point specified by
pointin an area chart.See also
This signal is emitted when the user releases a press that was triggered on
pointin an area chart.See also
- selected()#
Setter of property
borderColorᅟ.Sets the
brushused for filling the area.See also
Setter of property
colorᅟ.Sets the
penused for drawing the area outline.See also
- setPointLabelsClipping([enabled=true])#
- Parameters:
enabled – bool
See also
Setter of property
pointLabelsClippingᅟ.Setter of property
pointLabelsColorᅟ.Setter of property
pointLabelsFontᅟ.- setPointLabelsFormat(format)#
- Parameters:
format – str
See also
Setter of property
pointLabelsFormatᅟ.- setPointLabelsVisible([visible=true])#
- Parameters:
visible – bool
See also
Setter of property
pointLabelsVisibleᅟ.- setPointsVisible([visible=true])#
- Parameters:
visible – bool
Determines whether data points are
visibleand should be drawn on the line.See also
Back to top