- class QSplineSeries#
The
QSplineSeriesclass presents data as spline charts. More…Synopsis#
Methods#
def
__init__()
Note
This documentation may contain snippets that were automatically translated from C++ to Python. We always welcome contributions to the snippet translation. If you see an issue with the translation, you can also let us know by creating a ticket on https:/bugreports.qt.io/projects/PYSIDE
Detailed Description#
A spline series stores the data points and the segment control points needed by QPainterPath to draw a spline. The control points are automatically calculated when the data changes. The algorithm computes the points so that the normal spline can be drawn.
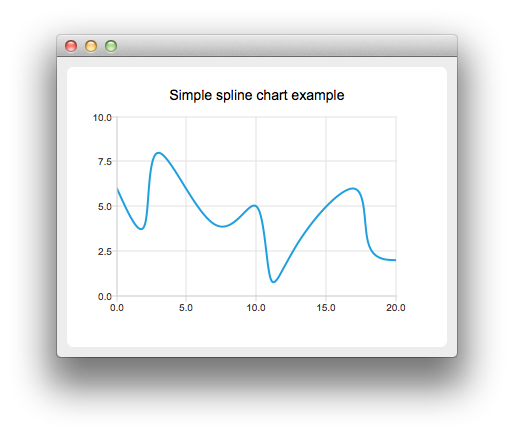
The following code snippet illustrates how to create a basic spline chart:
QSplineSeries* series = new QSplineSeries();
series->append(0, 6);
series->append(2, 4);
...
chart->addSeries(series);
Constructs an empty series object that is a child of
parent. When the series object is added to aQChartinstance, the ownerships is transferred.
Back to top