Debug remotely with GDB
When debugging on a target supported by GDB server, a local GDB process talks to a GDB server running on the remote machine that controls the process to be debugged.
The GDB server process is started on the remote machines by passing a port number and the executable:
gdbserver :1234 <executable>
It then typically responds:
Process bin/qtcreator created; pid = 5159
Listening on port 1234
On the local machine that runs Qt Creator:
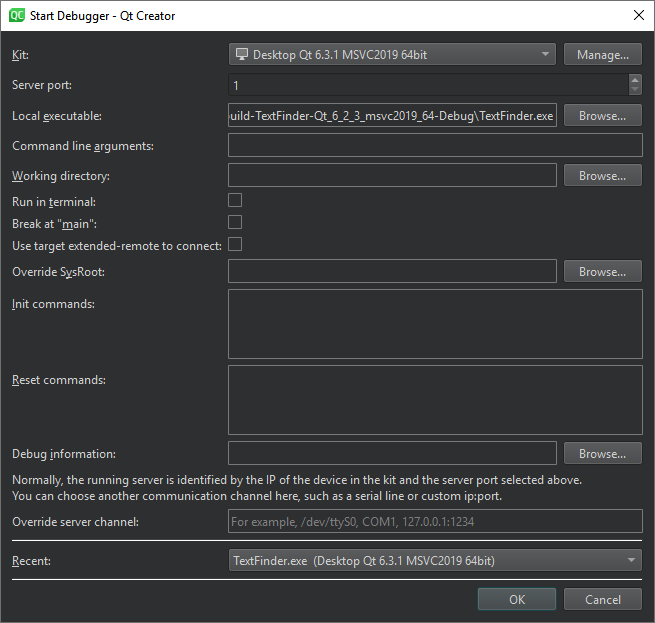
- Go to Debug > Start Debugging > Attach to Running Debug Server.

- In Kit, select the build and run kit to use for building the project.
- In Server port, enter the name of the remote machine and the port number to use.
- In Local executable, specify the path to the application executable on the local machine.
- In Command line arguments, specify command line arguments to be passed to the executable.
- In Working directory, specify the working directory. It defaults to the directory of the build result.
- Select Run in terminal for console applications.
- Select Break at "main" to stop the debugger at the main function.
- Select Use target extended-remote to connect to create the connection in the
target extended-remote mode. In this mode, when the debugged application exits or you detach from it, the debugger remains connected to the target. You can rerun the application, attach to a running application, or use monitor commands specific to the target. For example, GDB does not exit unless it was invoked using the--onceoption, but you can make it exit by using themonitor exitcommand. - In Override SysRoot, specify the path to the
sysrootto use instead of the defaultsysroot. - In Init commands, enter the commands to execute immediately after the connection to a target has been established.
- In Reset commands, enter the commands to execute when resetting the connection to a target.
- In Debug information, specify the location for storing debug information. You cannot use an empty path.
- In Override server channel, specify a communication channel to use, such as a serial line or custom port.
- In Recent, select a recent configuration to use.
- Select OK to start debugging.
By default, a non-responsive GDB process is terminated after 40 seconds. To increase the timeout in GDB timeout, go to Preferences > Debugger > GDB.
For more information about connecting with target extended-remote mode in GDB, see Debugging with GDB: Connecting to a Remote Target.
Use SSH port forwarding
To enable debugging on remote targets that cannot expose GDB server ports, map the remote ports to local ports using SSH tunneling. Qt Creator automatically detects the local and remote ports.
To turn on SSH port forwarding:
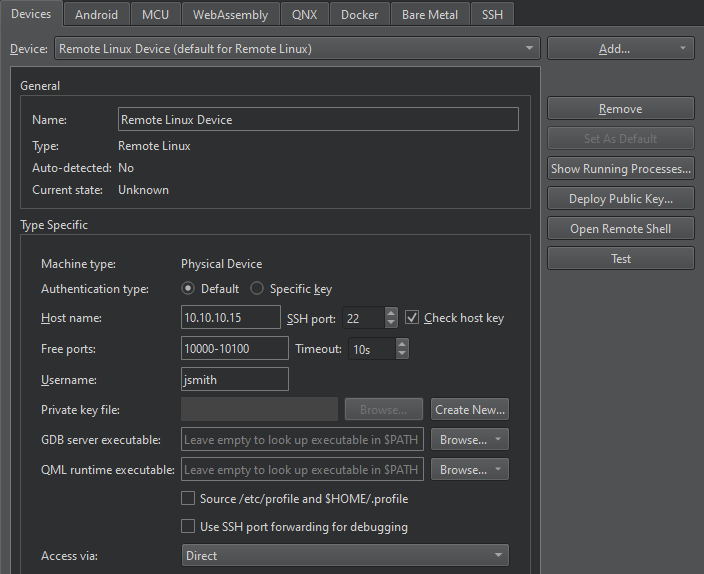
- Go to Preferences > Devices.

- In Device, select Remote Linux Device.
- Select Use SSH port forwarding for debugging.
- Select OK.
See also How To: Debug, How To: Develop for remote Linux, GDB, Debugging, Debuggers, Debugger, and Kits.
© 2024 The Qt Company Ltd. Documentation contributions included herein are the copyrights of their respective owners. The documentation provided herein is licensed under the terms of the GNU Free Documentation License version 1.3 as published by the Free Software Foundation. Qt and respective logos are trademarks of The Qt Company Ltd in Finland and/or other countries worldwide. All other trademarks are property of their respective owners.
