Debug Qt applications
You can interrupt a running application before it terminates or to find out why the application does not work correctly. Set breakpoints to stop the application for examining and changing variables, setting new breakpoints, or removing old ones, and then continue running the application.
When the application stops, you can examine certain data in the debugger. The availability of data depends on the compiler settings when compiling the application and the exact location where the application stops. Use the standard VS Code functions to step through the code and examine the changes in variables: step into, step over, and step out.
For more information, see VS Code: Debugging in the VS Code documentation.
Configure a project for debugging
To add a Qt debug configuration for an application:
- Go to Run and Debug (Ctrl+Shift+D or Cmd+Shift+D on macOS).
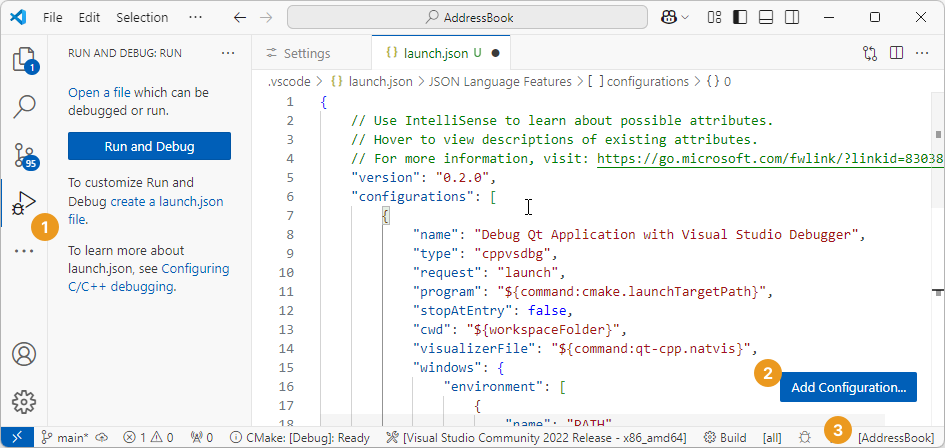
- Create a launch.json file (1) that contains launch configurations.
- Select Add Configuration (2), and then select a Qt: Debug debug configuration that matches your debugger.
- Check the launch target (3). To change it, select the target name or go to Command Palette and select CMake: Set Launch/Debug Target.
Debug source code
You can also debug the Qt source code. However, if you installed Qt with vcpkg, Qt Extension for VS Code cannot find the source code and shows a warning. To disable the warning:
- Go to Command Palette and select Open Qt settings.
- Select Qt C++ Configuration, and then select Do Not Warn Missing Source Dir.
Qt debug configurations
Select one of the following Qt debug configurations:
- Qt: Debug with cppdbg for debugging C/C++ applications with GDB.
- Qt: Debug with cppvsdbg (Windows) for debugging C/C++ applications with the Visual Studio Windows debugger.
- Qt: QML: Attach by port for attaching the QML debugger to a running application to debug QML code.
- Qt: QML: Launch for first starting an application and then attaching the QML debugger to it to debug QML code.
- Qt: Debug with cppdbg and QML debugger for debugging Qt Quick applications that contain C/C++ code with GDB and the QML debugger.
- Qt: Debug with cppvsdbg and QML debugger (Windows) for debugging Qt Quick applications that contain C/C++ code with the Visual Studio Windows debugger and the QML debugger.
- Qt: PySide: Launch for debugging Qt for Python applications with
debugpy. - Qt: PySide: Launch with QML Debugger for debugging Qt for Python and QML applications with
debugpyand QML debugger. - Qt: Debug with lldb for debugging with LLDB.
- Qt: Debug Qt WASM with Chrome for debugging Qt WebAssembly applications with Chrome.
See also Debug Qt Quick applications, Debug Qt for Python applications, Debug Qt WebAssembly applications, and VS Code: Debugging.
© 2026 The Qt Company Ltd. Documentation contributions included herein are the copyrights of their respective owners. The documentation provided herein is licensed under the terms of the GNU Free Documentation License version 1.3 as published by the Free Software Foundation. Qt and respective logos are trademarks of The Qt Company Ltd in Finland and/or other countries worldwide. All other trademarks are property of their respective owners.
