
Profile QML code
With QML Profiler, you can find causes for typical performance problems in Qt Quick applications, such as slowness and unresponsive, stuttering user interfaces.
You can launch QML Profiler from Qt Extension for Visual Studio Code to profile a running QML application and to analyze profiling data.
Install profiling tools
To profile QML applications, you need to install profiling tools. Go to Command Palette and select Qt: Download the most recent QML trace viewer.
If you do not install the profiling tools, Qt Extension for Visual Studio Code offers to install them the first time you start profiling a application.
To use a particular QML trace viewer executable, set the path to it in the QML Profiler settings.
Collect profiling data
To collect profiling data about the currently open application:
- Go to Command Palette and select Qt: Profile QML application or
 (Profile QML application) on the toolbar.
 - Use the application to collect profiling data.
- Close the application or select
 (Stop QML Profiler) on the toolbar.
Use QML Profiler to collect data, and analyze the results in the trace viewer.
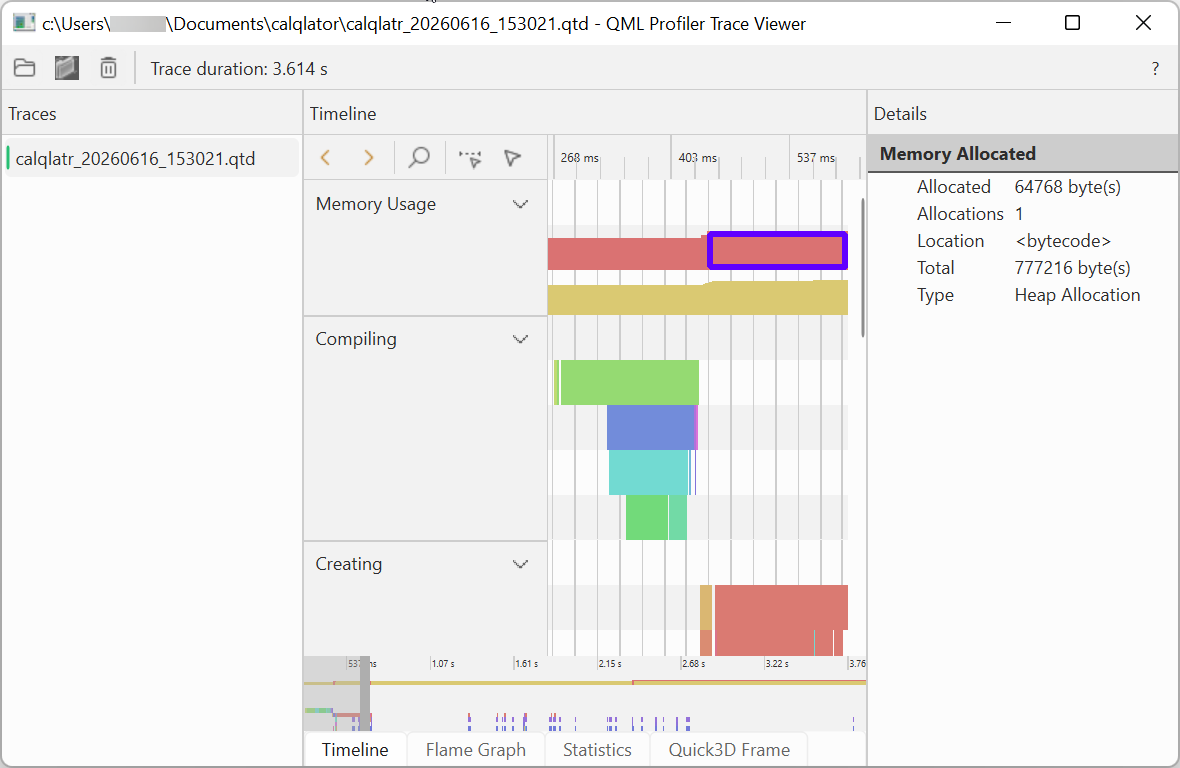
For more information, see Profiling QML applications in the Qt Creator documentation.
You can set arguments to pass to the application when you start QML Profiler in the QML Profiler settings.
Attach to running applications for profiling
To attach to a running application for collecting profiling data:
- In the Terminal, start the application with the following arguments:
<your_executable_path> -qmljsdebugger=host:<IP_address>,port:<port_number>,block,services:QmlProfiler,CanvasFrameRate
Where IP_address is the IP address of the host where the application is running, port_number is the debugging port, and block prevents the application from running until the debug client connects to the server. This enables profiling from the start.
- When the application is running, go to Command Palette, and select Qt: Attach to running QML application for profiling.
- Enter the IP address of the host, and then select Enter.
- Enter the port number, and then select Enter.
See also Qt settings.
© 2026 The Qt Company Ltd. Documentation contributions included herein are the copyrights of their respective owners. The documentation provided herein is licensed under the terms of the GNU Free Documentation License version 1.3 as published by the Free Software Foundation. Qt and respective logos are trademarks of The Qt Company Ltd in Finland and/or other countries worldwide. All other trademarks are property of their respective owners.
