Qt Graphs Overview for 3D
The Qt Graphs module provides a way to develop rapidly responding, complex, and dynamic 3D graphs for analytically demanding industries such as academic research and medical. Qt Graphs provides 3D bars, scatter, and surface graphs. Combining user interaction and real-time 3D drawing graphs enables creating user interfaces that use space effectively. Changing between 3D and 2D presentation enables truly utilizing the value of 3D in visualizing data.
The look and feel of the graphs can be customized by using the predefined themes or defining new ones. In addition, scenes can be customized by specifying settings for the camera, and individual items can be customized by using predefined or user-defined meshes.
Qt Graphs offers ready-made data proxies that can be used to visualize data from Qt item models and height maps. Each graph type has a basic proxy type, which accepts data in a format suitable for that graph. For more information, see Qt Graphs Data Handling with 3D.
End users can interact with the data presented by graphs in several ways, including rotating graphs, zooming into and out of data, selecting items, and viewing 2D slices of the 3D data for increased readability. For more information, see Qt Graphs Interacting with Data in 3D.
Graph Types
The Qt Graphs module provides the following 3D graph types:
The Q3DGraphsWidgetItem class provides a widget API for its own subclasses, Q3DBarsWidgetItem, Q3DScatterWidgetItem, and Q3DSurfaceWidgetItem that implement the different graph types: bars, scatter, and surface. The graph type determines how the data is presented.
All rendering happens in QQuickGraphsItem, which inherits a QQuick3DViewport, which in turn offers a View3D using QtQuick3D. It has its own subclasses for Bars3D, Scatter3D, and Surface3D.
3D Bar Graphs
3D bar graphs present data as 3D bars that are grouped by category. The Q3DGraphsWidgetItem class is used to create a graph. The QBar3DSeries and QBarDataProxy classes are used to set data to the graph and to control the visual properties of the graph, such as draw mode and shading. In QML, the corresponding types are Bars3D, Bar3DSeries, and BarDataProxy.
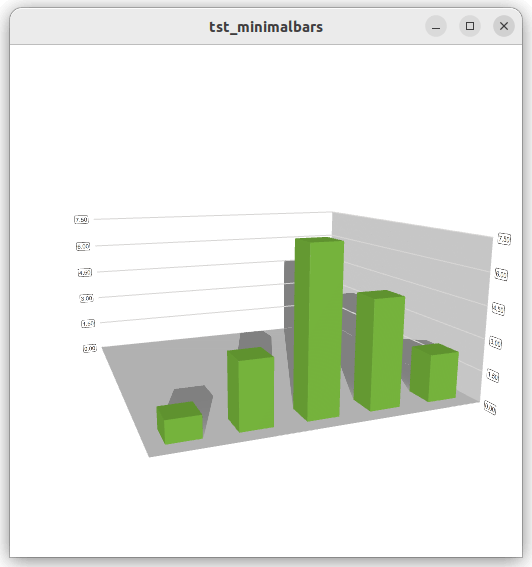
For more information, see How to construct a minimal Q3DBarsWidgetItem graph and Simple Bar Graph examples.
3D Scatter Graphs
3D scatter graphs present data as a collection of points. The Q3DScatterWidgetItem class is used to create a graph. The QScatter3DSeries and QScatterDataProxy classes are used to set data to the graph and to control the visual properties of the graph. In QML, the corresponding types are Scatter3D, Scatter3DSeries, and ScatterDataProxy.
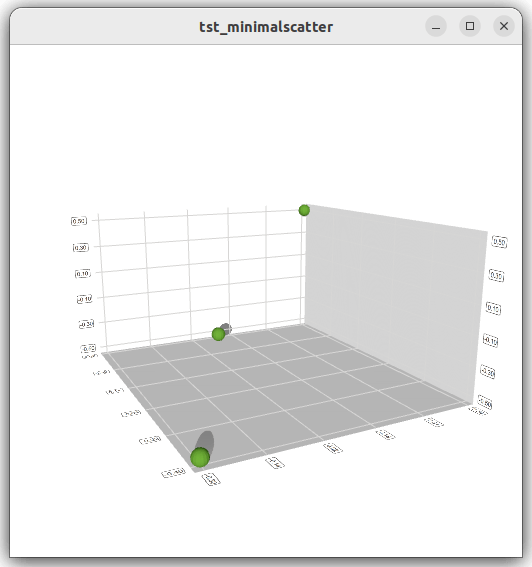
For more information, see How to construct a minimal Q3DScatterWidgetItem graph and Simple Scatter Graph examples.
3D Surface Graphs
3D surface graphs present data as 3D surface plots. The Q3DSurfaceWidgetItem class is used to create a graph. The QSurface3DSeries and QSurfaceDataProxy classes are used to set data to the graph and to control the visual properties of the graph. In QML, the corresponding types are Surface3D, Surface3DSeries, and SurfaceDataProxy.
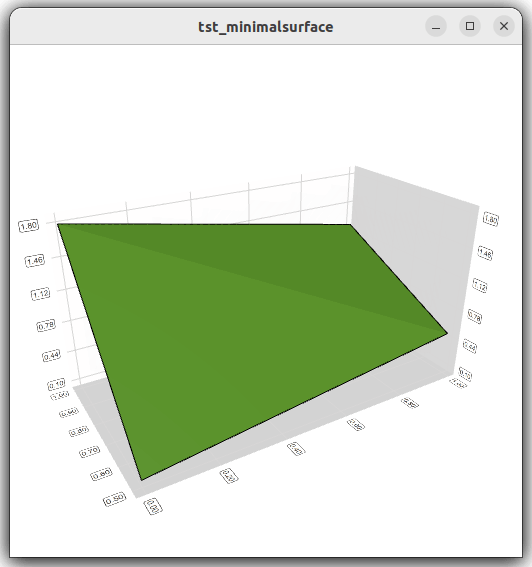
For more information, see How to construct a minimal Q3DSurfaceWidgetItem graph, Graph Gallery, and Surface Graph Gallery examples.
Using OpenGL ES for Rendering Data
Qt Graphs is based on QtQuick3D, that means Qt Graphs uses the native backend of the target platform for rendering. However, if OpenGL ES2 ends up being used in targets that do not support anything above it, such as OpenGL ES3 or Vulkan, the following features are not supported:
- Volumetric objects, because they use 3D textures
- Instancing, that means that QtGraphs3D::OptimizationHint::Default does not work, and QtGraphs3D::OptimizationHint::Legacy has to be used instead.
Selecting Rendering Mode
In QML, you can set the GraphsItem3D.RenderingMode property to determine whether the graph will be rendered directly on the window background or to an offscreen surface that is then drawn during normal QML item rendering.
Background rendering modes offer slightly better performance than the indirect rendering mode, at the cost of non-standard QML behavior. For example, the graphs do not support antialiasing. Therefore, changing the rendering mode is a question of performance versus quality.
Qt Quick uses a dedicated scenegraph for data rendering, and is therefore the best choice for graphs.
3D Axes
Qt Graphs supports the following axis types:
- Value axis
- Category axis
An axis can be set up to show a line or a grid. Both axis types are specializations of the QAbstract3DAxis class or the Abstract3DAxis QML type.
For a value axis, you can set a range of values and segment and subsegment counts to divide the range. Labels are drawn between each segment by default. Grid lines are drawn between each segment and each subsegment by default. The value axis is implemented using the QValue3DAxis class or the Value3DAxis QML type.
A category axis has named ranges and adjustable range widths. It is divided into equal-sized categories based on the data window size defined by the axis range. Labels are drawn to the positions of categories by default, if provided. Grid lines are drawn between categories by default. A category axis is implemented using the QCategory3DAxis class or the Category3DAxis QML type.
If no axes are set explicitly for a graph, temporary default axes with no labels are created. These default axes can be modified via axis accessors, but as soon as any axis is set explicitly for a particular orientation, the default axis for that orientation is destroyed.
All graph types support showing multiple series simultaneously. All the series do not need to contain the same number of rows and columns. Row and column labels are taken from the first series added, unless they are explicitly defined for the row and column axes.
Axis formatters can be used to customize value axis grid lines and labels. The QValue3DAxisFormatter class and Value3DAxisFormatter QML type provide formatting rules for a linear value 3D axis. The QLogValue3DAxisFormatter class and the LogValue3DAxisFormatter QML type provide formatting rules for a logarithmic value 3D axis.
Polar horizontal axes can be used for surface and scatter graphs by setting the polar property. It can be set for bars as well, but doing so will produce a warning and be ignored.
Customizing 3D Scenes
As Qt Graphs is built on top of QtQuick3D, it is possible to integrate QtQuick3D scenes into Qt Graphs scenes. For more information, see Qt Graphs Integration with Qt Quick 3D.
Customizing Items
Qt Graphs has predefined mesh types for bars and scatter items. The mesh type determines how a bar or a scatter item looks on a graph. You can also specify a custom geometry as a mesh file. For more information, see QAbstract3DSeries::userDefinedMesh(). For more variety, a quaternion can be set for mesh rotation.
In addition to customizing individual items, you can use the QCustom3DItem class or the Custom3DItem QML type to add custom items to graphs. The items have custom mesh, position, scaling, rotation, and an optional texture.
Use the QCustom3DVolume class and Custom3DVolume QML type to create volume-rendered objects to be added to a graph. A volume-rendered object is a box with a 3D texture. Three slice planes are supported for the volume, one along each main axis of the volume.
The QCustom3DLabel class and Custom3DLabel QML type implement custom labels with the specified text, font, position, scaling, and rotation. The active theme determines label colors, borders, and background.
Handling Custom Input
Qt Graphs implements default input handlers for typical actions like selecting, rotating, and zooming. To implement custom input handlers instead of the default ones, override the necessary input signals.
onTapped: {
    // Disable the default input handler
    unsetDefaultTapHandler()
    // Implement own custom event handler
    console.log("Custom tap event handler")
}
© 2026 The Qt Company Ltd. Documentation contributions included herein are the copyrights of their respective owners. The documentation provided herein is licensed under the terms of the GNU Free Documentation License version 1.3 as published by the Free Software Foundation. Qt and respective logos are trademarks of The Qt Company Ltd. in Finland and/or other countries worldwide. All other trademarks are property of their respective owners.
