Data Visualization Tool Tutorial
In this tutorial, you’ll learn about the data visualization capabilities of Qt for Python. To start with, find some open data to visualize. For example, data about the magnitude of earthquakes during the last hour published on the US Geological Survey website. You could download the All earthquakes open data in a CSV format for this tutorial.
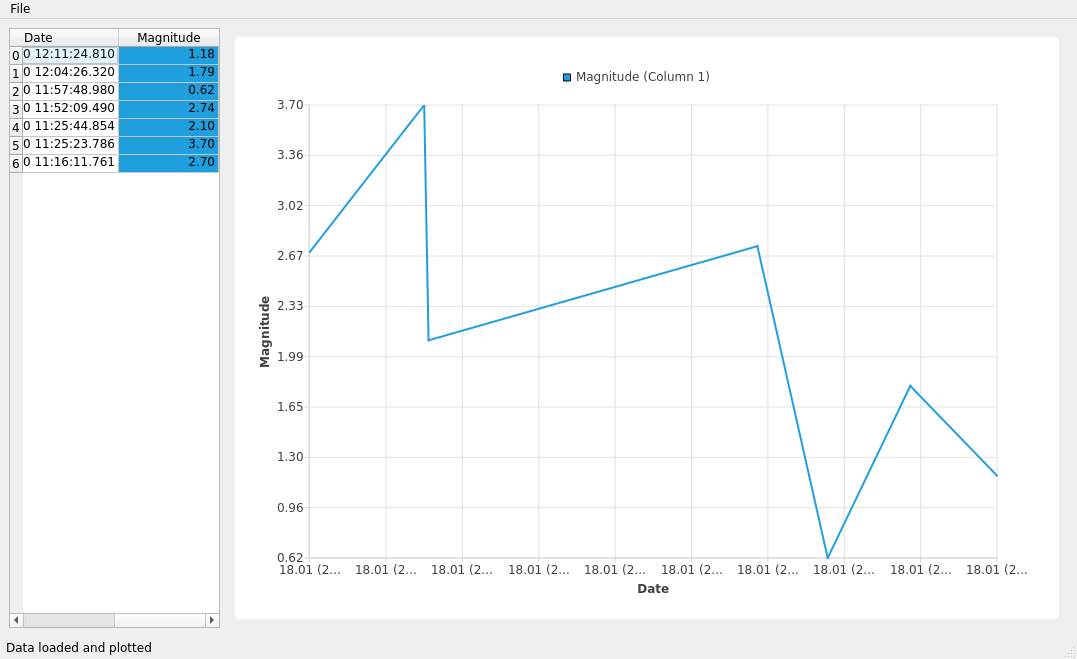
In the following chapters of this tutorial you’ll learn how to visualize data from a CSV in a line chart.
You can download the sources from here.