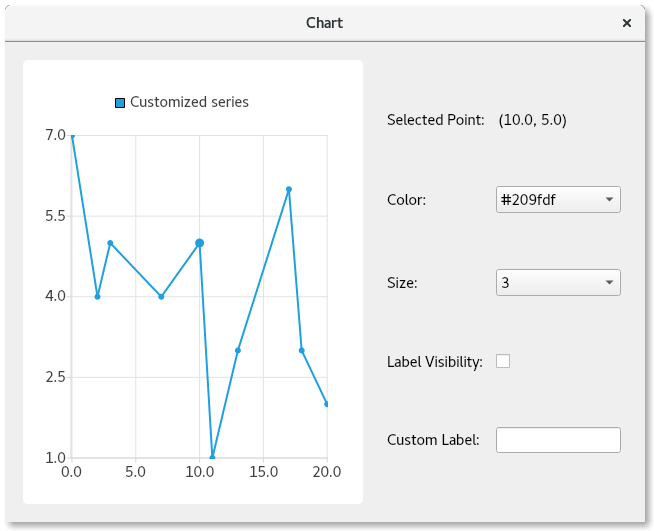
Selected Point Configuration Example
This example shows how to configure individual points of a QLineSeries.
Features demonstrated
In this application you will learn how to:
Select a series of points on click
Override the configuration for the following properties of specific points:
Color
Size
Label visibility
Text format of the label
Subclass QMainWindow
Create a subclass of QMainWindow to contain the chart and controls.
16class ChartWindow(QMainWindow):
17    def __init__(self, parent=None):
18        super().__init__(parent)
Create a line series
Create a QLineSeries containing the points to plot. Give it a name and make the points
visible.
20        self.setWindowTitle("Chart")
21        self._series = QLineSeries(self)
22        self._series.setName("Customized series")
23        self._series.setPointsVisible(True)
24        self._series.append([QPointF(0, 7), QPointF(2, 4),
25                             QPointF(3, 5), QPointF(7, 4),
26                             QPointF(10, 5), QPointF(11, 1),
27                             QPointF(13, 3), QPointF(17, 6),
28                             QPointF(18, 3), QPointF(20, 2)])
Create the point configuration controls
Now, create controls to configure the color, size, and label visibility attributes of a point.
Create an associated label for each control, so the user knows what the control does.
For the color and size, use a
QComboBox, populating it with a variety of colors and size choices.Create the final two controls. Create a
QCheckboxto control the visibility of the selected point, and aQLineEditto allow the user to provide a custom label for it.
Note
Do not set initial values for any of the controls, as a point will always be selected showing its current settings.
31        self._selected_point_index_lineedit = QLineEdit()
32        self._selected_point_index_lineedit.setReadOnly(True)
33        self._selected_point_index_lineedit.setStyleSheet(
34            "background-color: rgba(0, 0, 0, 0); border: 0px")
35
36        color_label = QLabel("Color: ")
37        self._color_combobox = QComboBox()
38        color_strings = ["red", "orange", "yellow", "green", "blue",
39                         "indigo", "violet", "black"]
40        for color_str in color_strings:
41            self._color_combobox.addItem(QIcon(), color_str, QColor(color_str))
42
43        size_label = QLabel("Size: ")
44        self._size_combobox = QComboBox()
45        for size in [2, 3, 4, 6, 8, 10, 12, 15]:
46            self._size_combobox.addItem(QIcon(), str(size), size)
47
48        label_visibility_label = QLabel("Label Visibility: ")
49        self._label_visibility_checkbox = QCheckBox()
50
51        custom_label_label = QLabel("Custom Label: ")
52        self._custom_label_lineedit = QLineEdit()
Populate the controls upon selecting a point
Add the logic to set the current control values depending on the chosen point. Note that the whole series value is used if there is no customization for a selected point. In this case, if the series is set to show blue points, a blue color value will be shown in the color combobox.
Perform some actions upon clicking on the lineseries. Look up the point clicked on and remove the
prior point selection. Finally, select the point that was clicked on. This makes the point larger to
indicate its selection. The current selected point’s index and PointConfigurations are saved
to a member variable for later use.
Query the PointConfigurations, and use those to find the matching indices in the combo boxes.
Set the current indices of the comboboxes to the corresponding values you looked up. Similarly,
look up the values in PointConfigurations, and update the checkbox and line edit controls.
54 self._series.clicked.connect(self._select_point)
 97    @Slot(QPointF)
 98    def _select_point(self, point: QPointF | int):
 99        try:
100            index = (self._series.points().index(point.toPoint()) if
101                     isinstance(point, QPointF) else point)
102        except ValueError:
103            # Do nothing if the place that was clicked on wasn't a point.
104            return
105
106        self._series.deselectAllPoints()
107        self._series.selectPoint(index)
108        self._selectedPointIndex = index
109        self._selectedPointConfig = self._series.pointConfiguration(index)
110        selected_point = self._series.at(index)
111        selected_index_lineedit = self._selected_point_index_lineedit
112        selected_index_lineedit.setText("(" + str(selected_point.x()) + ", "
113                                        + str(selected_point.y()) + ")")
114        config = self._series.pointConfiguration(index)
115
116        color = config.get(PointConfig.Color) or self._series.color()
117        size = config.get(PointConfig.Size) or self._series.markerSize()
118        labelVisibility = (config.get(PointConfig.LabelVisibility)
119                           or self._series.pointLabelsVisible())
120        customLabel = config.get(PointConfig.LabelFormat) or ""
121
122        combobox_value_list = [
123            (self._color_combobox, color.name(), color),
124            (self._size_combobox, str(size), size)
125        ]
126        for box, value_str, value in combobox_value_list:
127            if box.findData(value) < 0:
128                box.addItem(value_str, value)
129            box.setCurrentIndex(box.findData(value))
130
131        self._label_visibility_checkbox.setChecked(labelVisibility)
132        self._custom_label_lineedit.setText(customLabel)
Provide the logic to configure the selected point
Now that the controls are populated with some values, add logic to do something when the value
changes. Connect the control signals and the logic, to configure the selected point based on the
chosen values in the controls. You can do this by setting the QXYSeries::PointConfiguration
value that is associated with the control, to the m_selectedPointConfig and
PointConfigurations member variables, and call QXYSeries::setPointConfiguration.
55        self._color_combobox.activated.connect(self._set_color)
56        self._size_combobox.activated.connect(self._set_size)
57        label_vis_checkbox = self._label_visibility_checkbox
58        label_vis_checkbox.clicked.connect(self._set_label_visibility)
59        clabel_lineedit = self._custom_label_lineedit
60        clabel_lineedit.editingFinished.connect(self._set_custom_label)
140    @Slot(int)
141    def _set_size(self, index: int):
142        spc = self._selectedPointConfig
143        spc[PointConfig.Size] = self._size_combobox.currentData()
144        self._series.setPointConfiguration(self._selectedPointIndex, spc)
145
146    @Slot(bool)
147    def _set_label_visibility(self, checked: bool):
148        spc = self._selectedPointConfig
149        spc[PointConfig.LabelVisibility] = checked
150        self._series.setPointConfiguration(self._selectedPointIndex, spc)
151
152    @Slot()
153    def _set_custom_label(self):
154        spc = self._selectedPointConfig
155        spc[PointConfig.LabelFormat] = self._custom_label_lineedit.text()
156        self._series.setPointConfiguration(self._selectedPointIndex, spc)
Create the chart and lay out the controls
Finally, create the chart and its view, add the series to the chart, create the layout of the window, and select an initial point.
62        self._chart = QChart()
63        self._chart.addSeries(self._series)
64        self._chart.createDefaultAxes()
65
66        chart_view = QChartView(self._chart)
67        chart_view.setRenderHint(QPainter.RenderHint.Antialiasing)
68
69        control_widget = QWidget(self)
70        control_layout = QGridLayout(control_widget)
71        control_layout.setColumnStretch(1, 1)
72
73        control_layout.addWidget(selected_point_index_label, 0, 0)
74        control_layout.addWidget(self._selected_point_index_lineedit, 0, 1)
75
76        control_layout.addWidget(color_label, 1, 0)
77        control_layout.addWidget(self._color_combobox, 1, 1)
78
79        control_layout.addWidget(size_label, 2, 0)
80        control_layout.addWidget(self._size_combobox, 2, 1)
81
82        control_layout.addWidget(label_visibility_label, 3, 0)
83        control_layout.addWidget(self._label_visibility_checkbox, 3, 1, 1, 2)
84
85        control_layout.addWidget(custom_label_label, 4, 0)
86        control_layout.addWidget(self._custom_label_lineedit, 4, 1)
87
88        main_widget = QWidget(self)
89        main_layout = QHBoxLayout(main_widget)
90        main_layout.addWidget(chart_view)
91        main_layout.setStretch(0, 1)
92        main_layout.addWidget(control_widget)
93        self.setCentralWidget(main_widget)
94
95        self._select_point(4)
In our entrypoint file pointconfiguration.py, instantiate the ChartWindow, resize it, show
it, and start the event loop.
11
12if __name__ == "__main__":
13
14    a = QApplication(sys.argv)
15    main_window = ChartWindow()
16    main_window.resize(640, 480)
17    main_window.show()
You now have a fully functioning application that demonstrates how to customize individual chart points.
Usage
To use this example, click any point you’d like to customize, change any of the comboboxes and checkboxes controlling the individual point color, size, label visibility. You can customize the label text in the line edit at the bottom.
There are three special formatting strings for the label that you can use: @pointX, @pointY,
and @index. These are replaced with the x value, y value, and index of the point, respectively.
More information about that can be found in the documentation for
QtCharts.QXYSeries.pointLabelsFormat.
# Copyright (C) 2022 The Qt Company Ltd.
# SPDX-License-Identifier: LicenseRef-Qt-Commercial OR BSD-3-Clause
from __future__ import annotations

"""PySide6 port of the Light Markers Points Selection example from Qt v6.2"""
import sys
from PySide6.QtWidgets import QApplication

from chartwindow import ChartWindow


if __name__ == "__main__":

    a = QApplication(sys.argv)
    main_window = ChartWindow()
    main_window.resize(640, 480)
    main_window.show()
    sys.exit(a.exec())
# Copyright (C) 2022 The Qt Company Ltd.
# SPDX-License-Identifier: LicenseRef-Qt-Commercial OR BSD-3-Clause
from __future__ import annotations

"""PySide6 port of the Selected Point Configuration Example from Qt 6.5"""
from PySide6.QtCore import QPointF, Slot
from PySide6.QtGui import QColor, QIcon, QPainter
from PySide6.QtWidgets import QMainWindow, QLineEdit, QLabel, QComboBox
from PySide6.QtWidgets import QCheckBox, QWidget, QGridLayout, QHBoxLayout
from PySide6.QtCharts import QLineSeries, QXYSeries, QChart, QChartView


PointConfig = QXYSeries.PointConfiguration


class ChartWindow(QMainWindow):
    def __init__(self, parent=None):
        super().__init__(parent)

        self.setWindowTitle("Chart")
        self._series = QLineSeries(self)
        self._series.setName("Customized series")
        self._series.setPointsVisible(True)
        self._series.append([QPointF(0, 7), QPointF(2, 4),
                             QPointF(3, 5), QPointF(7, 4),
                             QPointF(10, 5), QPointF(11, 1),
                             QPointF(13, 3), QPointF(17, 6),
                             QPointF(18, 3), QPointF(20, 2)])

        selected_point_index_label = QLabel("Selected Point: ")
        self._selected_point_index_lineedit = QLineEdit()
        self._selected_point_index_lineedit.setReadOnly(True)
        self._selected_point_index_lineedit.setStyleSheet(
            "background-color: rgba(0, 0, 0, 0); border: 0px")

        color_label = QLabel("Color: ")
        self._color_combobox = QComboBox()
        color_strings = ["red", "orange", "yellow", "green", "blue",
                         "indigo", "violet", "black"]
        for color_str in color_strings:
            self._color_combobox.addItem(QIcon(), color_str, QColor(color_str))

        size_label = QLabel("Size: ")
        self._size_combobox = QComboBox()
        for size in [2, 3, 4, 6, 8, 10, 12, 15]:
            self._size_combobox.addItem(QIcon(), str(size), size)

        label_visibility_label = QLabel("Label Visibility: ")
        self._label_visibility_checkbox = QCheckBox()

        custom_label_label = QLabel("Custom Label: ")
        self._custom_label_lineedit = QLineEdit()

        self._series.clicked.connect(self._select_point)
        self._color_combobox.activated.connect(self._set_color)
        self._size_combobox.activated.connect(self._set_size)
        label_vis_checkbox = self._label_visibility_checkbox
        label_vis_checkbox.clicked.connect(self._set_label_visibility)
        clabel_lineedit = self._custom_label_lineedit
        clabel_lineedit.editingFinished.connect(self._set_custom_label)

        self._chart = QChart()
        self._chart.addSeries(self._series)
        self._chart.createDefaultAxes()

        chart_view = QChartView(self._chart)
        chart_view.setRenderHint(QPainter.RenderHint.Antialiasing)

        control_widget = QWidget(self)
        control_layout = QGridLayout(control_widget)
        control_layout.setColumnStretch(1, 1)

        control_layout.addWidget(selected_point_index_label, 0, 0)
        control_layout.addWidget(self._selected_point_index_lineedit, 0, 1)

        control_layout.addWidget(color_label, 1, 0)
        control_layout.addWidget(self._color_combobox, 1, 1)

        control_layout.addWidget(size_label, 2, 0)
        control_layout.addWidget(self._size_combobox, 2, 1)

        control_layout.addWidget(label_visibility_label, 3, 0)
        control_layout.addWidget(self._label_visibility_checkbox, 3, 1, 1, 2)

        control_layout.addWidget(custom_label_label, 4, 0)
        control_layout.addWidget(self._custom_label_lineedit, 4, 1)

        main_widget = QWidget(self)
        main_layout = QHBoxLayout(main_widget)
        main_layout.addWidget(chart_view)
        main_layout.setStretch(0, 1)
        main_layout.addWidget(control_widget)
        self.setCentralWidget(main_widget)

        self._select_point(4)

    @Slot(QPointF)
    def _select_point(self, point: QPointF | int):
        try:
            index = (self._series.points().index(point.toPoint()) if
                     isinstance(point, QPointF) else point)
        except ValueError:
            # Do nothing if the place that was clicked on wasn't a point.
            return

        self._series.deselectAllPoints()
        self._series.selectPoint(index)
        self._selectedPointIndex = index
        self._selectedPointConfig = self._series.pointConfiguration(index)
        selected_point = self._series.at(index)
        selected_index_lineedit = self._selected_point_index_lineedit
        selected_index_lineedit.setText("(" + str(selected_point.x()) + ", "
                                        + str(selected_point.y()) + ")")
        config = self._series.pointConfiguration(index)

        color = config.get(PointConfig.Color) or self._series.color()
        size = config.get(PointConfig.Size) or self._series.markerSize()
        labelVisibility = (config.get(PointConfig.LabelVisibility)
                           or self._series.pointLabelsVisible())
        customLabel = config.get(PointConfig.LabelFormat) or ""

        combobox_value_list = [
            (self._color_combobox, color.name(), color),
            (self._size_combobox, str(size), size)
        ]
        for box, value_str, value in combobox_value_list:
            if box.findData(value) < 0:
                box.addItem(value_str, value)
            box.setCurrentIndex(box.findData(value))

        self._label_visibility_checkbox.setChecked(labelVisibility)
        self._custom_label_lineedit.setText(customLabel)

    @Slot(int)
    def _set_color(self, index: int):
        spc = self._selectedPointConfig
        spc[PointConfig.Color] = self._color_combobox.currentData()
        self._series.setPointConfiguration(self._selectedPointIndex, spc)

    @Slot(int)
    def _set_size(self, index: int):
        spc = self._selectedPointConfig
        spc[PointConfig.Size] = self._size_combobox.currentData()
        self._series.setPointConfiguration(self._selectedPointIndex, spc)

    @Slot(bool)
    def _set_label_visibility(self, checked: bool):
        spc = self._selectedPointConfig
        spc[PointConfig.LabelVisibility] = checked
        self._series.setPointConfiguration(self._selectedPointIndex, spc)

    @Slot()
    def _set_custom_label(self):
        spc = self._selectedPointConfig
        spc[PointConfig.LabelFormat] = self._custom_label_lineedit.text()
        self._series.setPointConfiguration(self._selectedPointIndex, spc)