How to Edit and Debug Test Scripts
In addition to tools for recording and editing tests, Squish also provides support for debugging test scripts and for inspecting the AUT's internal objects. The debugger is not only useful for finding and fixing bugs in test scripts, but also—using its breakpoint facility—for inspecting a running AUT.
How to Use the Script Debugger
The Squish IDE's script debugger allows us to set breakpoints in our test scripts (see Debug view). This can be useful for when we want to insert verification points (see Inserting Additional Verification Points), or for recording from a breakpoint onwards, as discussed later in this section. Once a test script has stopped at a breakpoint we can continue test execution normally by clicking the Resume toolbar button (or by pressing F8; Resume action), or we can step through the test script by clicking Run > StepInto (or by pressing F5; Step Into action) or by clicking Run > StepOver (or by pressing F6; Step Over action). Alternatively, we can simply stop the test execution by clicking the Terminate toolbar button (Ctrl+F2; Terminate action).
While at a breakpoint it is possible to use Squish's debugger to see the call stack and to use the Squish Spy to examine application objects' property values and to insert verification points.
How to Record After a Breakpoint
In some cases it is useful to extend an existing test case with further actions. But it would be tedious to have to re-record the entire test from scratch just, for example, to click an additional button in the test. One solution it to simply edit the test script and add in a few lines with the additional actions that are required. But sometimes it is more convenient to simply record the extra actions at the point in the script where they are required.
Recording just a part of what is needed can also be useful in other contexts. One common use case is if we know that every one of a whole group of tests must always start out the same way by performing some initializing actions on the AUT—for example, opening a file of test data. We could easily just record these actions and then store them in a shared script. Then, for each new test case, we could write in the one line necessary to load in a shared script (see How to Store and Locate Shared Scripts and Shared Data Files)—or we could create the test from a template with the line already in place (see Testcase Templates)—and then record the text from that point onwards.
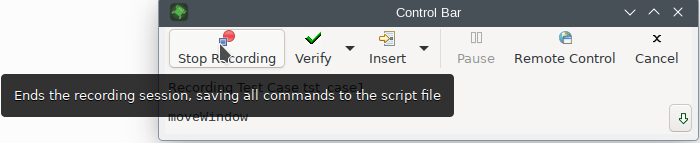
Squish's controlbar window's Stop Recording toolbar button
Recording within an existing test is made possible by setting a breakpoint in an existing test script at the point where the newly recorded actions should be inserted. Once the breakpoint is in place, execute the test. It will stop executing as soon as the breakpoint is reached. Now click Run > Record Snippet (Record Snippet action). This will make Squish start recording on the running AUT. Interact with the AUT to perform the new actions, and once you have finished, click Squish's controlbar window's Stop Recording button (Stop Recording action) to stop the recording. Now click the Resume toolbar button (or press F8) or the Terminate toolbar button (Ctrl+F2). Once the script has finished or been stopped the newly recorded actions will be inserted into the test script at the breakpoint. At this point the entire script can be run again, this time including the newly recorded actions.
How to Use the Spy
In the tutorials we saw how to insert verification points by using the Squish Spy. See Inserting Additional Verification Points. Two approaches can be used: we can record a test script and then insert breakpoints into it—then run the test and add verifications at each breakpoint. Or we can record a test script and add verifications as we go along using the Verify > Properties action and Verify > Screenshot action available from the Control Bar Window.
In either case, when a breakpoint is reached or a verification insertion is attempted, Squish will switch to the Spy Perspective so that application objects and their properties can be inspected and verification points inserted as required.
It is also possible to use the Spy independently. Simply click the Launch AUT toolbar button; this will start the AUT and switch Squish to the Spy Perspective. Interact with the AUT however you like, and at any point you can see the current Application Objects in the Application Objects view and the currently selected Object's Properties in the Properties view.
Those Objects in the Application Objects view that have child objects can be expanded to reveal these objects (and so on, recursively). There is also a context menu that offers options for copying the current object's symbolic or real (multi-property) name to the clipboard: this is useful if you want to refer to the object in a test script that you are writing or editing. (In general it is best to use the symbolic name.) If you do this, be sure to invoke the context menu a second time and choose the Add to Object Map option so that Squish will remember the object and recognize it when you use it in your test cases.
There is also a view that shows each Object's methods (Methods view). In general, any of these methods can be used in test scripts, for example to test that a particular widget has the expected state.
The Spy is especially useful when writing test scripts by hand since it can be used to find out the names of the AUT's objects and which of their properties are accessible and what methods they provide.
Note: A fast alternative to using the Spy tool when you want to find out the names of lots of objects, is to create a dummy test. During this test you must interact with all the objects you want to use in your test script. This will make Squish add entries for all the objects to the Object Map in one go. You can then copy and paste the names—preferably the symbolic ones—into your test script as needed, and then delete the dummy test.
When you start spying on an AUT, at first the main window (or first web page) is shown in the Application Objects view along with all its child objects. If you then pop up a dialog, neither the dialog nor its child objects are shown in the Application Objects view. This is easily remedied by clicking the Application Objects view's Refresh toolbar button. (You can also do a refresh after the dialog has been closed to remove the dialog objects that are shown in the Application Objects view.)
The Spy (Spy Perspective) has two modes of operation: Normal (which is the default) and Pick. The Normal mode is almost always sufficient (along with the use of the Application Objects view's Refresh toolbar button). However, Squish also provides the Pick mode which makes it possible to view one particular object in the Application Objects view.
Before entering Pick mode, interact with the AUT to make the object you are interested in visible. Then click the Application Objects view's Pick toolbar button. This will switch Squish into pick mode—Squish's main window will disappear and instead the Control Bar Window will be shown. Now click the AUT's active window to give the AUT the focus. As you move the mouse over the window each object (i.e., widget) will be highlighted by being outlined in red. In addition, Squish will show the highlighted object's real name in a tooltip.
Once the object you are interested in is highlighted click (or double-click depending on your platform and settings) it to pick it—this will also return the Spy to its Normal mode. Now the object will be shown as the sole entry in the Application Objects view with its properties shown in the Properties view. As usual you can copy its name to the clipboard and add it to the Object Map using the context menu.
To finish spying, click the Quit AUT toolbar button. This will make Squish stop the AUT and return to the Test Management Perspective.
© 2025 The Qt Company Ltd.
Documentation contributions included herein are the copyrights of
their respective owners.
The documentation provided herein is licensed under the terms of the GNU Free Documentation License version 1.3 as published by the Free Software Foundation.
Qt and respective logos are trademarks of The Qt Company Ltd. in Finland and/or other countries worldwide. All other trademarks are property
of their respective owners.
