Bar Chart Example
The example shows how to create a Bar chart.
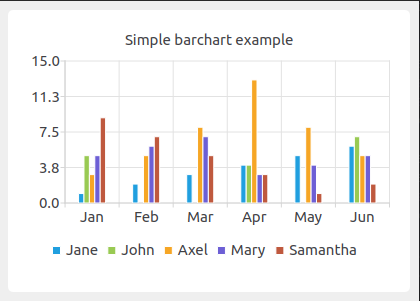
from __future__ import annotations

"""PySide6 port of the linechart example from Qt v6.x"""

import sys

from PySide6.QtCharts import (QBarCategoryAxis, QBarSeries, QBarSet, QChart,
                              QChartView, QValueAxis)
from PySide6.QtCore import Qt
from PySide6.QtGui import QPainter
from PySide6.QtWidgets import QApplication, QMainWindow


class TestChart(QMainWindow):
    def __init__(self):
        super().__init__()

        self.set_0 = QBarSet("Jane")
        self.set_1 = QBarSet("John")
        self.set_2 = QBarSet("Axel")
        self.set_3 = QBarSet("Mary")
        self.set_4 = QBarSet("Samantha")

        self.set_0.append([1, 2, 3, 4, 5, 6])
        self.set_1.append([5, 0, 0, 4, 0, 7])
        self.set_2.append([3, 5, 8, 13, 8, 5])
        self.set_3.append([5, 6, 7, 3, 4, 5])
        self.set_4.append([9, 7, 5, 3, 1, 2])

        self.series = QBarSeries()
        self.series.append(self.set_0)
        self.series.append(self.set_1)
        self.series.append(self.set_2)
        self.series.append(self.set_3)
        self.series.append(self.set_4)

        self.chart = QChart()
        self.chart.addSeries(self.series)
        self.chart.setTitle("Simple barchart example")
        self.chart.setAnimationOptions(QChart.SeriesAnimations)

        self.categories = ["Jan", "Feb", "Mar", "Apr", "May", "Jun"]
        self.axis_x = QBarCategoryAxis()
        self.axis_x.append(self.categories)
        self.chart.addAxis(self.axis_x, Qt.AlignBottom)
        self.series.attachAxis(self.axis_x)

        self.axis_y = QValueAxis()
        self.axis_y.setRange(0, 15)
        self.chart.addAxis(self.axis_y, Qt.AlignLeft)
        self.series.attachAxis(self.axis_y)

        self.chart.legend().setVisible(True)
        self.chart.legend().setAlignment(Qt.AlignBottom)

        self._chart_view = QChartView(self.chart)
        self._chart_view.setRenderHint(QPainter.RenderHint.Antialiasing)

        self.setCentralWidget(self._chart_view)


if __name__ == "__main__":
    app = QApplication(sys.argv)

    window = TestChart()
    window.show()
    window.resize(420, 300)
    sys.exit(app.exec())