Simple Bar Graph
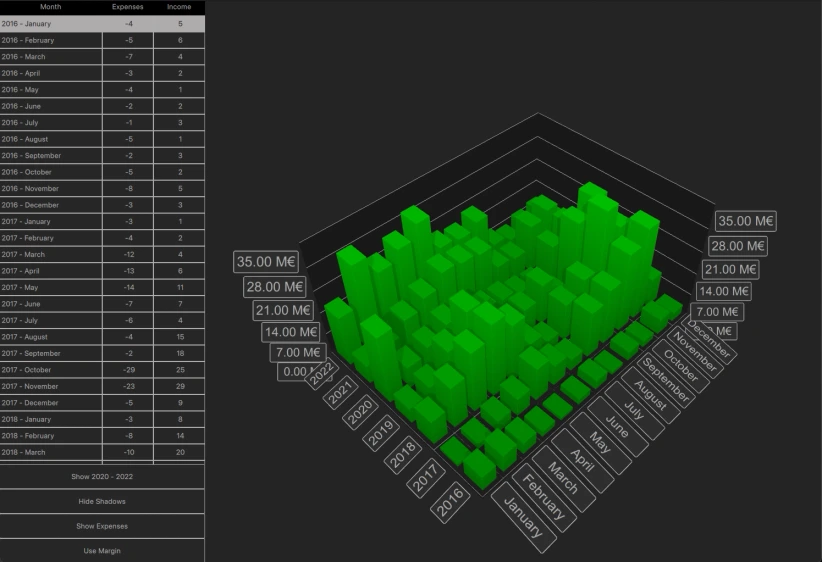
The Qt 3D Bar Graph example demonstrates creating a 3D bar graph in QML using Bars3D. It visualizes fictional company data for income and expenses over time, showcasing features like data series switching, custom axis labels, and interactive data selection.
import sys
from pathlib import Path

from PySide6.QtGui import QGuiApplication
from PySide6.QtQuick import QQuickView


if __name__ == '__main__':
    app = QGuiApplication(sys.argv)
    view = QQuickView()

    view.engine().addImportPath(Path(__file__).parent)
    view.loadFromModule("Bars", "Main")
    view.setTitle("Monthly income / expenses")
    view.setResizeMode(QQuickView.ResizeMode.SizeRootObjectToView)
    view.setColor("black")
    view.show()

    ex = app.exec()
    del view
    sys.exit(ex)
import QtQuick
import QtQuick.Controls.Basic
import QtQuick.Layouts
import QtGraphs
import Qt.labs.qmlmodels
pragma ComponentBehavior: Bound
Item {
id: mainview
width: 1280
height: 1024
property int buttonLayoutHeight: 180
property int currentRow
state: Screen.width < Screen.height ? "portrait" : "landscape"
Data {
id: graphData
}
Axes {
id: graphAxes
}
property Bar3DSeries selectedSeries
selectedSeries: barSeries
function handleSelectionChange(series, position) {
if (position !== series.invalidSelectionPosition)
selectedSeries = series
// Set tableView current row to selected bar
var rowRole = series.rowLabels[position.x]
var colRole
if (barGraph.columnAxis == graphAxes.total)
colRole = "01"
else
colRole = series.columnLabels[position.y]
var checkTimestamp = rowRole + "-" + colRole
if (currentRow === -1 || checkTimestamp !== graphData.model.get(currentRow).timestamp) {
var totalRows = tableView.rows
for (var i = 0; i < totalRows; i++) {
var modelTimestamp = graphData.model.get(i).timestamp
if (modelTimestamp === checkTimestamp) {
currentRow = i
break
}
}
}
}
ColumnLayout {
id: tableViewLayout
anchors.top: parent.top
anchors.left: parent.left
HorizontalHeaderView {
id: headerView
readonly property var columnNames: ["Month", "Expenses", "Income"]
syncView: tableView
Layout.fillWidth: true
delegate: Text {
required property int index
padding: 3
text: headerView.columnNames[index]
color: barGraph.theme.labelTextColor
horizontalAlignment: Text.AlignHCenter
verticalAlignment: Text.AlignVCenter
elide: Text.ElideRight
}
}
TableView {
id: tableView
Layout.fillWidth: true
Layout.fillHeight: true
reuseItems: false
clip: true
model: TableModel {
id: tableModel
TableModelColumn { display: "timestamp" }
TableModelColumn { display: "expenses" }
TableModelColumn { display: "income" }
rows: graphData.modelAsJsArray
}
delegate: Rectangle {
id: delegateRoot
required property int row
required property int column
required property string display
implicitHeight: 30
implicitWidth: column === 0 ? tableView.width / 2 : tableView.width / 4
color: row === mainview.currentRow ? barGraph.theme.grid.mainColor
: barGraph.theme.backgroundColor
border.color: row === mainview.currentRow ? barGraph.theme.labelTextColor
: barGraph.theme.grid.mainColor
border.width: 1
MouseArea {
anchors.fill: parent
onClicked: {
mainview.currentRow = delegateRoot.row
//! [2]
var timestamp = graphData.model.get(mainview.currentRow).timestamp
var pattern = /(\d\d\d\d)-(\d\d)/
var matches = pattern.exec(timestamp)
var rowIndex = modelProxy.rowCategoryIndex(matches[1])
var colIndex
if (barGraph.columnAxis == graphAxes.total)
colIndex = 0 // Just one column when showing yearly totals
else
colIndex = modelProxy.columnCategoryIndex(matches[2])
if (selectedSeries.visible)
mainview.selectedSeries.selectedBar = Qt.point(rowIndex, colIndex)
else if (barSeries.visible)
barSeries.selectedBar = Qt.point(rowIndex, colIndex)
else
secondarySeries.selectedBar = Qt.point(rowIndex, colIndex)
//! [2]
}
}
Text {
id: delegateText
anchors.verticalCenter: parent.verticalCenter
width: parent.width
anchors.leftMargin: 4
anchors.left: parent.left
anchors.right: parent.right
text: formattedText
property string formattedText: {
if (delegateRoot.column === 0) {
if (delegateRoot.display !== "") {
var pattern = /(\d\d\d\d)-(\d\d)/
var matches = pattern.exec(delegateRoot.display)
var colIndex = parseInt(matches[2], 10) - 1
return matches[1] + " - " + graphAxes.column.labels[colIndex]
}
} else {
return delegateRoot.display
}
}
color: delegateRoot.row === mainview.currentRow ? barGraph.theme.backgroundColor
: barGraph.theme.labelTextColor
horizontalAlignment: delegateRoot.column === 0 ? Text.AlignLeft
: Text.AlignHCenter
elide: Text.ElideRight
}
}
}
}
ColumnLayout {
id: controlLayout
spacing: 0
Button {
id: changeDataButton
Layout.fillWidth: true
Layout.fillHeight: true
text: "Show 2020 - 2022"
clip: true
//! [1]
onClicked: {
if (text === "Show yearly totals") {
modelProxy.autoRowCategories = true
secondaryProxy.autoRowCategories = true
modelProxy.columnRolePattern = /^.*$/
secondaryProxy.columnRolePattern = /^.*$/
graphAxes.value.autoAdjustRange = true
barGraph.columnAxis = graphAxes.total
text = "Show all years"
} else if (text === "Show all years") {
modelProxy.autoRowCategories = true
secondaryProxy.autoRowCategories = true
modelProxy.columnRolePattern = /^.*-(\d\d)$/
secondaryProxy.columnRolePattern = /^.*-(\d\d)$/
graphAxes.value.min = 0
graphAxes.value.max = 35
barGraph.columnAxis = graphAxes.column
text = "Show 2020 - 2022"
} else { // text === "Show 2020 - 2022"
// Explicitly defining row categories, since we do not want to show data for
// all years in the model, just for the selected ones.
modelProxy.autoRowCategories = false
secondaryProxy.autoRowCategories = false
modelProxy.rowCategories = ["2020", "2021", "2022"]
secondaryProxy.rowCategories = ["2020", "2021", "2022"]
text = "Show yearly totals"
}
}
//! [1]
contentItem: Text {
text: changeDataButton.text
opacity: changeDataButton.enabled ? 1.0 : 0.3
color: barGraph.theme.labelTextColor
horizontalAlignment: Text.AlignHCenter
verticalAlignment: Text.AlignVCenter
elide: Text.ElideRight
}
background: Rectangle {
opacity: changeDataButton.enabled ? 1 : 0.3
color: changeDataButton.down ? barGraph.theme.grid.mainColor : barGraph.theme.backgroundColor
border.color: changeDataButton.down ? barGraph.theme.labelTextColor : barGraph.theme.grid.mainColor
border.width: 1
radius: 2
}
}
Button {
id: shadowToggle
Layout.fillWidth: true
Layout.fillHeight: true
text: "Hide Shadows"
clip: true
onClicked: {
if (barGraph.shadowQuality == Graphs3D.ShadowQuality.None) {
barGraph.shadowQuality = Graphs3D.ShadowQuality.SoftHigh
text = "Hide Shadows"
} else {
barGraph.shadowQuality = Graphs3D.ShadowQuality.None
text = "Show Shadows"
}
}
contentItem: Text {
text: shadowToggle.text
opacity: shadowToggle.enabled ? 1.0 : 0.3
color: barGraph.theme.labelTextColor
horizontalAlignment: Text.AlignHCenter
verticalAlignment: Text.AlignVCenter
elide: Text.ElideRight
}
background: Rectangle {
opacity: shadowToggle.enabled ? 1 : 0.3
color: shadowToggle.down ? barGraph.theme.grid.mainColor : barGraph.theme.backgroundColor
border.color: shadowToggle.down ? barGraph.theme.labelTextColor : barGraph.theme.grid.mainColor
border.width: 1
radius: 2
}
}
Button {
id: seriesToggle
Layout.fillWidth: true
Layout.fillHeight: true
text: "Show Expenses"
clip: true
//! [0]
onClicked: {
if (text === "Show Expenses") {
barSeries.visible = false
secondarySeries.visible = true
barGraph.valueAxis.labelFormat = "-%.2f M\u20AC"
secondarySeries.itemLabelFormat = "Expenses, @colLabel, @rowLabel: @valueLabel"
text = "Show Both"
} else if (text === "Show Both") {
barSeries.visible = true
barGraph.valueAxis.labelFormat = "%.2f M\u20AC"
secondarySeries.itemLabelFormat = "Expenses, @colLabel, @rowLabel: -@valueLabel"
text = "Show Income"
} else { // text === "Show Income"
secondarySeries.visible = false
text = "Show Expenses"
}
}
//! [0]
contentItem: Text {
text: seriesToggle.text
opacity: seriesToggle.enabled ? 1.0 : 0.3
color: barGraph.theme.labelTextColor
horizontalAlignment: Text.AlignHCenter
verticalAlignment: Text.AlignVCenter
elide: Text.ElideRight
}
background: Rectangle {
opacity: seriesToggle.enabled ? 1 : 0.3
color: seriesToggle.down ? barGraph.theme.grid.mainColor : barGraph.theme.backgroundColor
border.color: seriesToggle.down ? barGraph.theme.labelTextColor : barGraph.theme.grid.mainColor
border.width: 1
radius: 2
}
}
Button {
id: marginToggle
Layout.fillWidth: true
Layout.fillHeight: true
text: "Use Margin"
clip: true
onClicked: {
if (text === "Use Margin") {
barGraph.barSeriesMargin = Qt.size(0.2, 0.2)
barGraph.barSpacing = Qt.size(0.0, 0.0)
text = "Use Spacing"
} else if (text === "Use Spacing") {
barGraph.barSeriesMargin = Qt.size(0.0, 0.0)
barGraph.barSpacing = Qt.size(0.5, 0.5)
text = "Use Margin"
}
}
contentItem: Text {
text: marginToggle.text
opacity: marginToggle.enabled ? 1.0 : 0.3
color: barGraph.theme.labelTextColor
horizontalAlignment: Text.AlignHCenter
verticalAlignment: Text.AlignVCenter
elide: Text.ElideRight
}
background: Rectangle {
opacity: marginToggle.enabled ? 1 : 0.3
color: marginToggle.down ? barGraph.theme.grid.mainColor : barGraph.theme.backgroundColor
border.color: marginToggle.down ? barGraph.theme.labelTextColor : barGraph.theme.grid.mainColor
border.width: 1
radius: 2
}
}
}
Item {
id: dataView
anchors.right: mainview.right
anchors.bottom: mainview.bottom
Bars3D {
id: barGraph
anchors.fill: parent
shadowQuality: Graphs3D.ShadowQuality.SoftHigh
selectionMode: Graphs3D.SelectionFlag.Item
theme: GraphsTheme {
colorScheme: GraphsTheme.ColorScheme.Dark
labelBorderVisible: true
labelFont.pointSize: 35
labelBackgroundVisible: true
colorStyle: GraphsTheme.ColorStyle.RangeGradient
singleHighlightGradient: customGradient
Gradient {
id: customGradient
GradientStop { position: 1.0; color: "#FFFF00" }
GradientStop { position: 0.0; color: "#808000" }
}
}
barThickness: 0.7
barSpacing: Qt.size(0.5, 0.5)
barSpacingRelative: false
cameraPreset: Graphs3D.CameraPreset.IsometricLeftHigh
columnAxis: graphAxes.column
rowAxis: graphAxes.row
valueAxis: graphAxes.value
//! [4]
Bar3DSeries {
id: secondarySeries
visible: false
itemLabelFormat: "Expenses, @colLabel, @rowLabel: -@valueLabel"
baseGradient: secondaryGradient
ItemModelBarDataProxy {
id: secondaryProxy
itemModel: graphData.model
rowRole: "timestamp"
columnRole: "timestamp"
valueRole: "expenses"
rowRolePattern: /^(\d\d\d\d).*$/
columnRolePattern: /^.*-(\d\d)$/
valueRolePattern: /-/
rowRoleReplace: "\\1"
columnRoleReplace: "\\1"
multiMatchBehavior: ItemModelBarDataProxy.MultiMatchBehavior.Cumulative
}
//! [4]
Gradient {
id: secondaryGradient
GradientStop { position: 1.0; color: "#FF0000" }
GradientStop { position: 0.0; color: "#600000" }
}
onSelectedBarChanged: (position) => mainview.handleSelectionChange(secondarySeries,
position)
}
//! [3]
Bar3DSeries {
id: barSeries
itemLabelFormat: "Income, @colLabel, @rowLabel: @valueLabel"
baseGradient: barGradient
ItemModelBarDataProxy {
id: modelProxy
itemModel: graphData.model
rowRole: "timestamp"
columnRole: "timestamp"
valueRole: "income"
rowRolePattern: /^(\d\d\d\d).*$/
columnRolePattern: /^.*-(\d\d)$/
rowRoleReplace: "\\1"
columnRoleReplace: "\\1"
multiMatchBehavior: ItemModelBarDataProxy.MultiMatchBehavior.Cumulative
}
//! [3]
Gradient {
id: barGradient
GradientStop { position: 1.0; color: "#00FF00" }
GradientStop { position: 0.0; color: "#006000" }
}
onSelectedBarChanged: (position) => mainview.handleSelectionChange(barSeries,
position)
}
}
}
states: [
State {
name: "landscape"
PropertyChanges {
target: dataView
width: mainview.width / 4 * 3
height: mainview.height
}
PropertyChanges {
target: tableViewLayout
height: mainview.height - buttonLayoutHeight
anchors.right: dataView.left
anchors.left: mainview.left
anchors.bottom: undefined
}
PropertyChanges {
target: controlLayout
width: mainview.width / 4
height: buttonLayoutHeight
anchors.top: tableViewLayout.bottom
anchors.bottom: mainview.bottom
anchors.left: mainview.left
anchors.right: dataView.left
}
},
State {
name: "portrait"
PropertyChanges {
target: dataView
width: mainview.width
height: mainview.width
}
PropertyChanges {
target: tableViewLayout
height: mainview.width
anchors.right: controlLayout.left
anchors.left: mainview.left
anchors.bottom: dataView.top
}
PropertyChanges {
target: controlLayout
width: mainview.height / 4
height: mainview.width / 4
anchors.top: mainview.top
anchors.bottom: dataView.top
anchors.left: undefined
anchors.right: mainview.right
}
}
]
}
import QtQuick
import QtQml.Models

Item {
    property alias model: dataModel

    property var modelAsJsArray: {
        var arr = [];
        for (var i = 0; i < dataModel.count; i++) {
            var row = dataModel.get(i);
            arr.push({
                         timestamp: row.timestamp,
                         expenses: row.expenses,
                         income: row.income
                     });
        }
        return arr;
    }

    //! [0]
    ListModel {
        id: dataModel
        ListElement{ timestamp: "2016-01"; expenses: "-4";  income: "5" }
        ListElement{ timestamp: "2016-02"; expenses: "-5";  income: "6" }
        ListElement{ timestamp: "2016-03"; expenses: "-7";  income: "4" }
        //! [0]
        ListElement{ timestamp: "2016-04"; expenses: "-3";  income: "2" }
        ListElement{ timestamp: "2016-05"; expenses: "-4";  income: "1" }
        ListElement{ timestamp: "2016-06"; expenses: "-2";  income: "2" }
        ListElement{ timestamp: "2016-07"; expenses: "-1";  income: "3" }
        ListElement{ timestamp: "2016-08"; expenses: "-5";  income: "1" }
        ListElement{ timestamp: "2016-09"; expenses: "-2";  income: "3" }
        ListElement{ timestamp: "2016-10"; expenses: "-5";  income: "2" }
        ListElement{ timestamp: "2016-11"; expenses: "-8";  income: "5" }
        ListElement{ timestamp: "2016-12"; expenses: "-3";  income: "3" }

        ListElement{ timestamp: "2017-01"; expenses: "-3";  income: "1" }
        ListElement{ timestamp: "2017-02"; expenses: "-4";  income: "2" }
        ListElement{ timestamp: "2017-03"; expenses: "-12"; income: "4" }
        ListElement{ timestamp: "2017-04"; expenses: "-13"; income: "6" }
        ListElement{ timestamp: "2017-05"; expenses: "-14"; income: "11" }
        ListElement{ timestamp: "2017-06"; expenses: "-7";  income: "7" }
        ListElement{ timestamp: "2017-07"; expenses: "-6";  income: "4" }
        ListElement{ timestamp: "2017-08"; expenses: "-4";  income: "15" }
        ListElement{ timestamp: "2017-09"; expenses: "-2";  income: "18" }
        ListElement{ timestamp: "2017-10"; expenses: "-29"; income: "25" }
        ListElement{ timestamp: "2017-11"; expenses: "-23"; income: "29" }
        ListElement{ timestamp: "2017-12"; expenses: "-5";  income: "9" }

        ListElement{ timestamp: "2018-01"; expenses: "-3";  income: "8" }
        ListElement{ timestamp: "2018-02"; expenses: "-8";  income: "14" }
        ListElement{ timestamp: "2018-03"; expenses: "-10"; income: "20" }
        ListElement{ timestamp: "2018-04"; expenses: "-12"; income: "24" }
        ListElement{ timestamp: "2018-05"; expenses: "-10"; income: "19" }
        ListElement{ timestamp: "2018-06"; expenses: "-5";  income: "8" }
        ListElement{ timestamp: "2018-07"; expenses: "-1";  income: "4" }
        ListElement{ timestamp: "2018-08"; expenses: "-7";  income: "12" }
        ListElement{ timestamp: "2018-09"; expenses: "-4";  income: "16" }
        ListElement{ timestamp: "2018-10"; expenses: "-22"; income: "33" }
        ListElement{ timestamp: "2018-11"; expenses: "-16"; income: "25" }
        ListElement{ timestamp: "2018-12"; expenses: "-2";  income: "7" }

        ListElement{ timestamp: "2019-01"; expenses: "-4";  income: "5"  }
        ListElement{ timestamp: "2019-02"; expenses: "-4";  income: "7"  }
        ListElement{ timestamp: "2019-03"; expenses: "-11"; income: "14"  }
        ListElement{ timestamp: "2019-04"; expenses: "-16"; income: "22"  }
        ListElement{ timestamp: "2019-05"; expenses: "-3";  income: "5"  }
        ListElement{ timestamp: "2019-06"; expenses: "-4";  income: "8"  }
        ListElement{ timestamp: "2019-07"; expenses: "-7";  income: "9"  }
        ListElement{ timestamp: "2019-08"; expenses: "-9";  income: "13"  }
        ListElement{ timestamp: "2019-09"; expenses: "-1";  income: "6"  }
        ListElement{ timestamp: "2019-10"; expenses: "-14"; income: "25"  }
        ListElement{ timestamp: "2019-11"; expenses: "-19"; income: "29"  }
        ListElement{ timestamp: "2019-12"; expenses: "-5";  income: "7"  }

        ListElement{ timestamp: "2020-01"; expenses: "-14"; income: "22"  }
        ListElement{ timestamp: "2020-02"; expenses: "-5";  income: "7"  }
        ListElement{ timestamp: "2020-03"; expenses: "-1";  income: "9"  }
        ListElement{ timestamp: "2020-04"; expenses: "-1";  income: "12"  }
        ListElement{ timestamp: "2020-05"; expenses: "-5";  income: "9"  }
        ListElement{ timestamp: "2020-06"; expenses: "-5";  income: "8"  }
        ListElement{ timestamp: "2020-07"; expenses: "-3";  income: "7"  }
        ListElement{ timestamp: "2020-08"; expenses: "-1";  income: "5"  }
        ListElement{ timestamp: "2020-09"; expenses: "-2";  income: "4"  }
        ListElement{ timestamp: "2020-10"; expenses: "-10"; income: "13"  }
        ListElement{ timestamp: "2020-11"; expenses: "-12"; income: "17"  }
        ListElement{ timestamp: "2020-12"; expenses: "-6";  income: "9"  }

        ListElement{ timestamp: "2021-01"; expenses: "-2";  income: "6"  }
        ListElement{ timestamp: "2021-02"; expenses: "-4";  income: "8"  }
        ListElement{ timestamp: "2021-03"; expenses: "-7";  income: "12"  }
        ListElement{ timestamp: "2021-04"; expenses: "-9";  income: "15"  }
        ListElement{ timestamp: "2021-05"; expenses: "-7";  income: "19"  }
        ListElement{ timestamp: "2021-06"; expenses: "-9";  income: "18"  }
        ListElement{ timestamp: "2021-07"; expenses: "-13"; income: "17"  }
        ListElement{ timestamp: "2021-08"; expenses: "-5";  income: "9"  }
        ListElement{ timestamp: "2021-09"; expenses: "-3";  income: "8"  }
        ListElement{ timestamp: "2021-10"; expenses: "-13"; income: "15"  }
        ListElement{ timestamp: "2021-11"; expenses: "-8";  income: "17"  }
        ListElement{ timestamp: "2021-12"; expenses: "-7";  income: "10"  }

        ListElement{ timestamp: "2022-01"; expenses: "-12";  income: "16"  }
        ListElement{ timestamp: "2022-02"; expenses: "-24";  income: "28"  }
        ListElement{ timestamp: "2022-03"; expenses: "-27";  income: "22"  }
        ListElement{ timestamp: "2022-04"; expenses: "-29";  income: "25"  }
        ListElement{ timestamp: "2022-05"; expenses: "-27";  income: "29"  }
        ListElement{ timestamp: "2022-06"; expenses: "-19";  income: "18"  }
        ListElement{ timestamp: "2022-07"; expenses: "-13";  income: "17"  }
        ListElement{ timestamp: "2022-08"; expenses: "-15";  income: "19"  }
        ListElement{ timestamp: "2022-09"; expenses: "-3";   income: "8"  }
        ListElement{ timestamp: "2022-10"; expenses: "-3";   income: "6"  }
        ListElement{ timestamp: "2022-11"; expenses: "-4";   income: "8"  }
        ListElement{ timestamp: "2022-12"; expenses: "-5";   income: "9"  }
    }
}
import QtQuick
import QtGraphs

Item {
    property alias column: columnAxis
    property alias row: rowAxis
    property alias value: valueAxis
    property alias total: totalAxis

    // Custom labels for columns, since the data contains abbreviated month names.
    //! [0]
    Category3DAxis {
        id: columnAxis
        labels: ["January", "February", "March", "April", "May", "June",
            "July", "August", "September", "October", "November", "December"]
        labelAutoAngle: 30
    }
    //! [0]
    Category3DAxis {
        id: totalAxis
        labels: ["Yearly total"]
        labelAutoAngle: 30
    }
    Category3DAxis {
        // For row labels we can use row labels from data proxy, no labels defined for rows.
        id: rowAxis
        labelAutoAngle: 30
    }

    Value3DAxis {
        id: valueAxis
        min: 0
        max: 35
        labelFormat: "%.2f M\u20AC"
        title: "Monthly income"
        labelAutoAngle: 90
    }
}
module Bars
Main 1.0 Main.qml
Axes 1.0 Axes.qml
Data 1.0 Data.qml